Fundamentals of Rendering Data as an SVG Bar Graph with D3 and scaleBand
CRANK
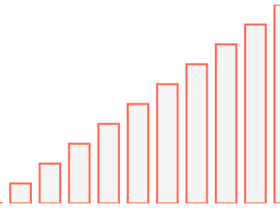
In this lesson we'll start by using `d3-scale` to build up a `scaleBand` for our `x` data and a `scaleLinear` for our `y` data points to allow them to map and extrapolate our data correctly to renderable bars. We'll add in `padding` between each bar, and then using the svg `rect` will render a collection of bars. ![](