
Introducing diagnostics improvements in .NET Core 3.0
In .NET Core 3.0, we are introducing a suite of tools that utilize new features in the .NET runtime that make it easier to diagnose and solve performance problems.
These runtime features help you answer some common diagnostic questions you may have:
- Is my application healthy?
- Why does my application have anomalous behavior?
- Why did my application crash?
Is my application healthy?
Often times an application can slowly start leaking memory and eventually result in an out of memory exception. Other times, certain problematic code paths may result in a spike in CPU utilization. These are just some of the classes of problem you can pro-actively identify with metrics.
Metrics
Metrics are a representation of data measures over intervals of time. Metrics (or time-series) data allow you to observe the state of your system at a high-level. Unlike the .NET Framework on Windows, .NET Core doesn’t emit perf counters. Instead, we had introduced a new way of emitting metrics in .NET Core via the EventCounter API.
EventCounters offer an improvement over Windows perf counters as these are now usable on all OSes where .NET Core is supported. Additionally, unlike perf counters, they are also usable in low privilege environments (like xcopy deployments). Unfortunately, the lack of a tool like Performance Monitor (perfmon) made it difficult to consume these metrics in real time.
dotnet-counters
In 3.0-preview5, we are introducing a new command-line tool for observing metrics emitted by .NET Core Applications in real time.
You can install this .NET global tool by running the following command
dotnet tool install --global dotnet-counters --version 1.0.3-preview5.19251.2
In the example below, we see the CPU utilization and working set memory of our application jump up when we point a load generator at our web application.
For detailed instructions on how to use this tool, look at the dotnet-counters readme. For known limitations with dotnet-counters, look at the open issues on GitHub.
Why does my application have anomalous behavior?
While metrics help identify the occurence of anomalous behavior, they offer little visibility into what went wrong. To answer the question why your application has anomalous behavior you need to collect additional information via traces. As an example, CPU profiles collected via tracing can help you identify the hot path in your code.
Tracing
Traces are immutable timestamped records of discrete events. Traces contain local context that allow you to better infer the fate of a system. Traditionally, the .NET Framework (and frameworks like ASP.NET) emitted diagnostic traces about its internals via Event Tracing for Windows (ETW). In .NET Core, these trace were written to ETW on Windows and LTTng on Linux.
dotnet-trace
In 3.0-preview5, every .NET Core application opens a duplex pipe named EventPipe (Unix domain socket on *nix/named pipe on Windows) over which it can emit events. While we’re still working on the controller protocol, dotnet-trace implements the preview version of this protocol.
You can install this .NET global tool by running the following command
dotnet tool install --global dotnet-trace--version 1.0.3-preview5.19251.2
In the example above, I’m running dotnet trace with the default profile which enables the CPU profiler events and the .NET runtime events.
In addition to the default events, you can enable additional providers based on the investigation you are trying to perform.
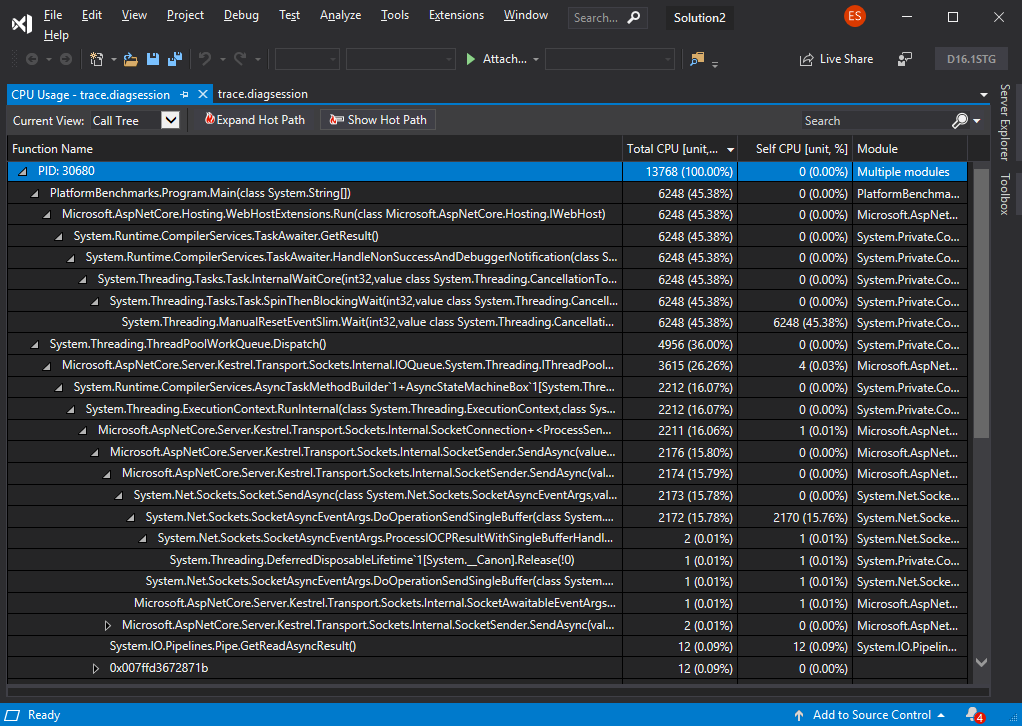
As a result of running dotnet trace you are presented with a .netperf file. This file contains both the runtime events and sampled CPU stacks that can be visualized in perfview. The next update of Visual Studio (16.1) will also add support for visualizing these traces.
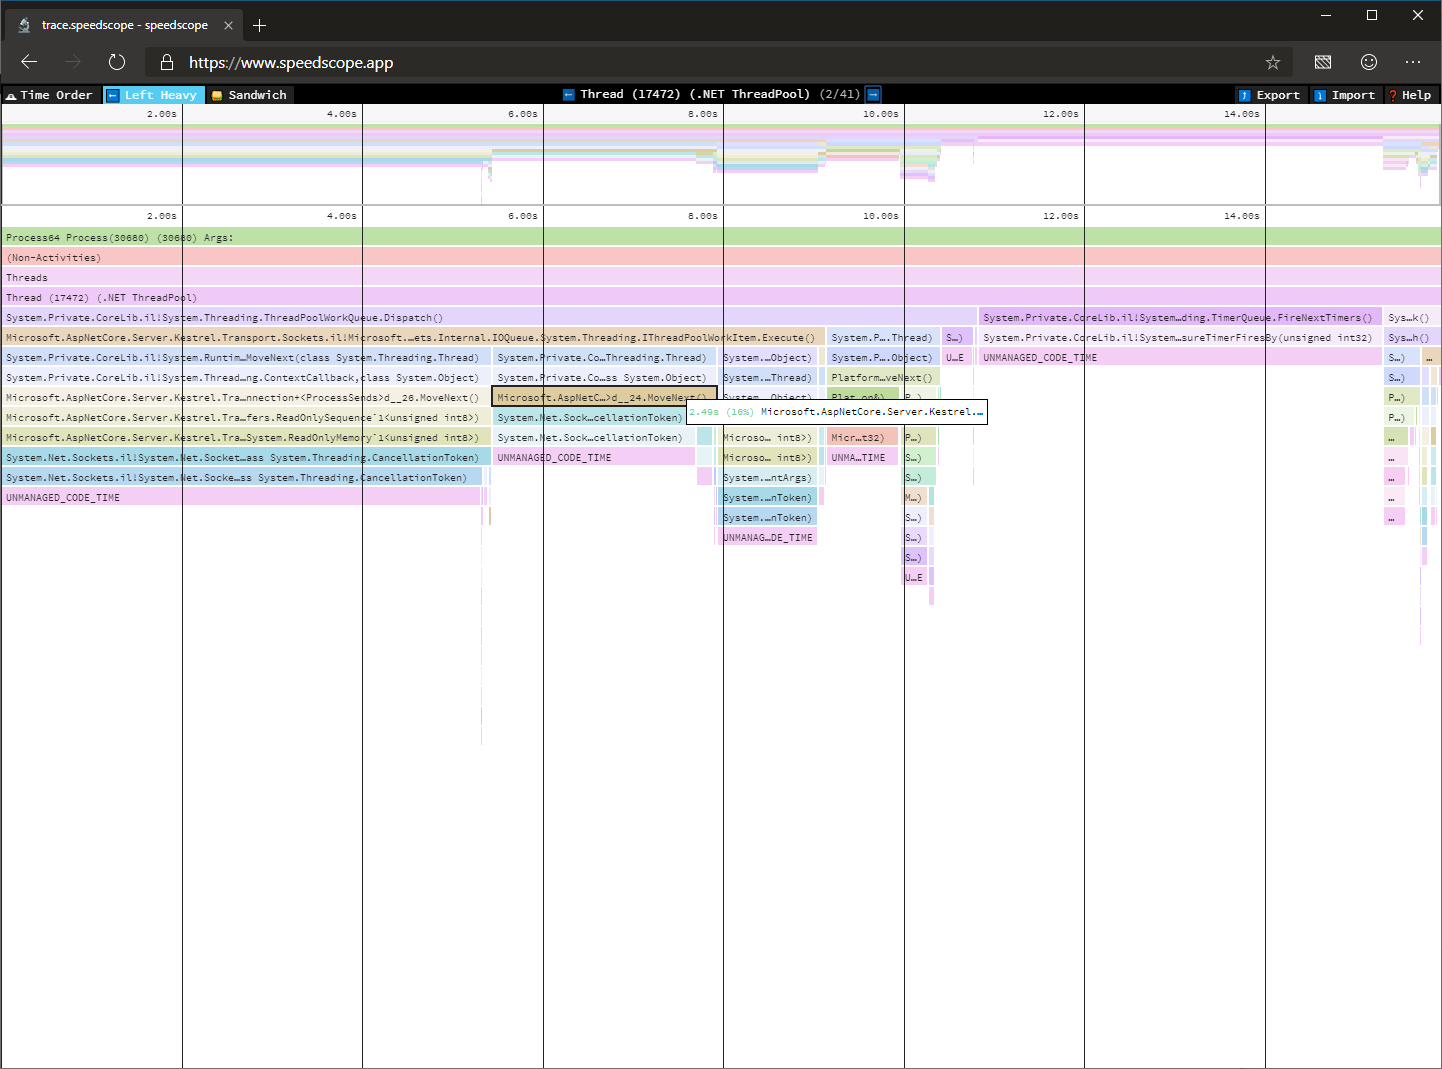
If you’re running on OS X or Linux when you capture a trace, you can choose to convert these .netperf files to .speedscope.json files that can be visualized with Speedscope.app.
You can convert an existing trace by running the following command
dotnet trace convert <input-netperf-file>
The image below shows the icicle chart visualizing the trace we just captured in speedscope.
For detailed instructions on how to use this tool, look at the dotnet-trace readme. For known limitations with dotnet-trace, look at the open issues on GitHub.
Why did my application crash?
In some cases, it is not possible to ascertain what caused anomalous behavior by just tracing the process. In the event that the process crashed or situations where we may need more information like access to entire process heap, a process dump may be more suitable for analysis.
Dump Analysis
A dump is a recording of the state of working virtual memory of a process usually captured when the process has terminated unexpectedly. Diagnosing core dump is commonly used to identify the causes of application crashes or unexpected behavior.
Traditionally, you relied on your operating system to capture a dump on application crash (e.g., Windows Error Reporting) or used a tool like procdump to capture a dump when certain trigger criteria are met.
The challenge thus far with capturing dumps with .NET on Linux was capturing dumps with gcore or a debugger resulted extremely large dumps as the existing tools didn’t know what virtual memory pages to trim in a .NET Core process.
Additionally, it was challenging to analyze these dumps even after you had collected them as it required acquiring a debugger and configuring it to load sos, a debugger extension for .NET.
dotnet-dump
3.0.0-preview5, we’re introducing a new tool that allows you to capture and analyze process dumps on both Windows and Linux.
dotnet-dump is still under active development and the table below shows what functionality is currently supported on what operating systems.
| Windows | OS X | Linux | |
| Collect |
✅
|
❌
|
✅
|
| Analyze |
❌
|
❌
|
✅
|
You can install this .NET global tool by running the following command
dotnet tool install --global dotnet-dump --version 1.0.3-preview5.19251.2
Once you’ve installed dotnet dump, you can capture a process dump by running the following command
sudo $HOME/.dotnet/tools/dotnet-dump collect -p <pid>
On Linux, the resulting dump can be analyzed by loading the resulting dump by running the following command
dotnet dump analyze <dump-name>
In the following example, I try to determine ASP.NET Core Hosting Environment of a crashed dump by walking the heap.
For detailed instructions on how to use this tool, look at the dotnet-dump readme. For known limitations with dotnet-dump, look at the open issues on GitHub.
Closing
Thanks for trying out the new diagnostics tools in .NET Core 3.0. Please continue to give us feedback, either in the comments or on GitHub. We are listening carefully and will continue to make changes based on your feedback.
 Light
Light Dark
Dark
7 comments
Great article,
just one observation, the code
dotnet tool install --global dotnet-trace--version 1.0.3-preview5.19251.2is missing space:dotnet tool install --global dotnet-trace --version 1.0.3-preview5.19251.2Cool, thank you.
From what I understand, on Windows a memory mapped file & interlocks are used to store the Performance counters and wondering if this is true on Linux? Also on Windows using the RawValue property directly has up to a 5 times performance improvement, is similar true on Linux? Lastly any guidance on limits & resource utilization for how many perf counters can be monitored per host on Windows / Linux, for example:
– Can I collect on 1000 individual performance counters every 10 seconds (1 GB / day)? – Impact on host / container CPU and memory whilst monitoring 1000 individual performance counters every 10 seconds etc?The Increment, IncrementBy, and Decrement methods use interlocks to update the counter value. This helps keep the counter value accurate in multithreaded or multiprocess scenarios, but also results in a performance penalty. If you do not need the accuracy that interlocked operations provide, you can update the RawValue property directly for up to a 5 times performance improvement. However, in multithreaded scenarios, some updates to the counter value might be ignored, resulting in inaccurate data.
For this one “Unfortunately, the lack of a tool like Performance Monitor (perfmon) made it difficult to consume these metrics in real time.” I think that on Linux based systems you can collect the metrics using Prometheus which uses Grafana by default for visualization.
Could you please describe the way to consume these metrics using Prometheus?
How do I collect a trace for a console application that runs several seconds?
I’m looking for a way to combine
with
If you are able to modify the code of the console application, simply add a pause.