R言語もすなる生存分析といふものをGo言語もしてみむとするなり。
R言語やPythonで作ると簡単にできるのですが、Goで作ってるもので統計データを元に自動判定させてなんかゴニョゴニョしてみたいときにどうやるんだろうということでやってみました。
設計
Exploratoryで作ったものがあるので、これをベースにします。
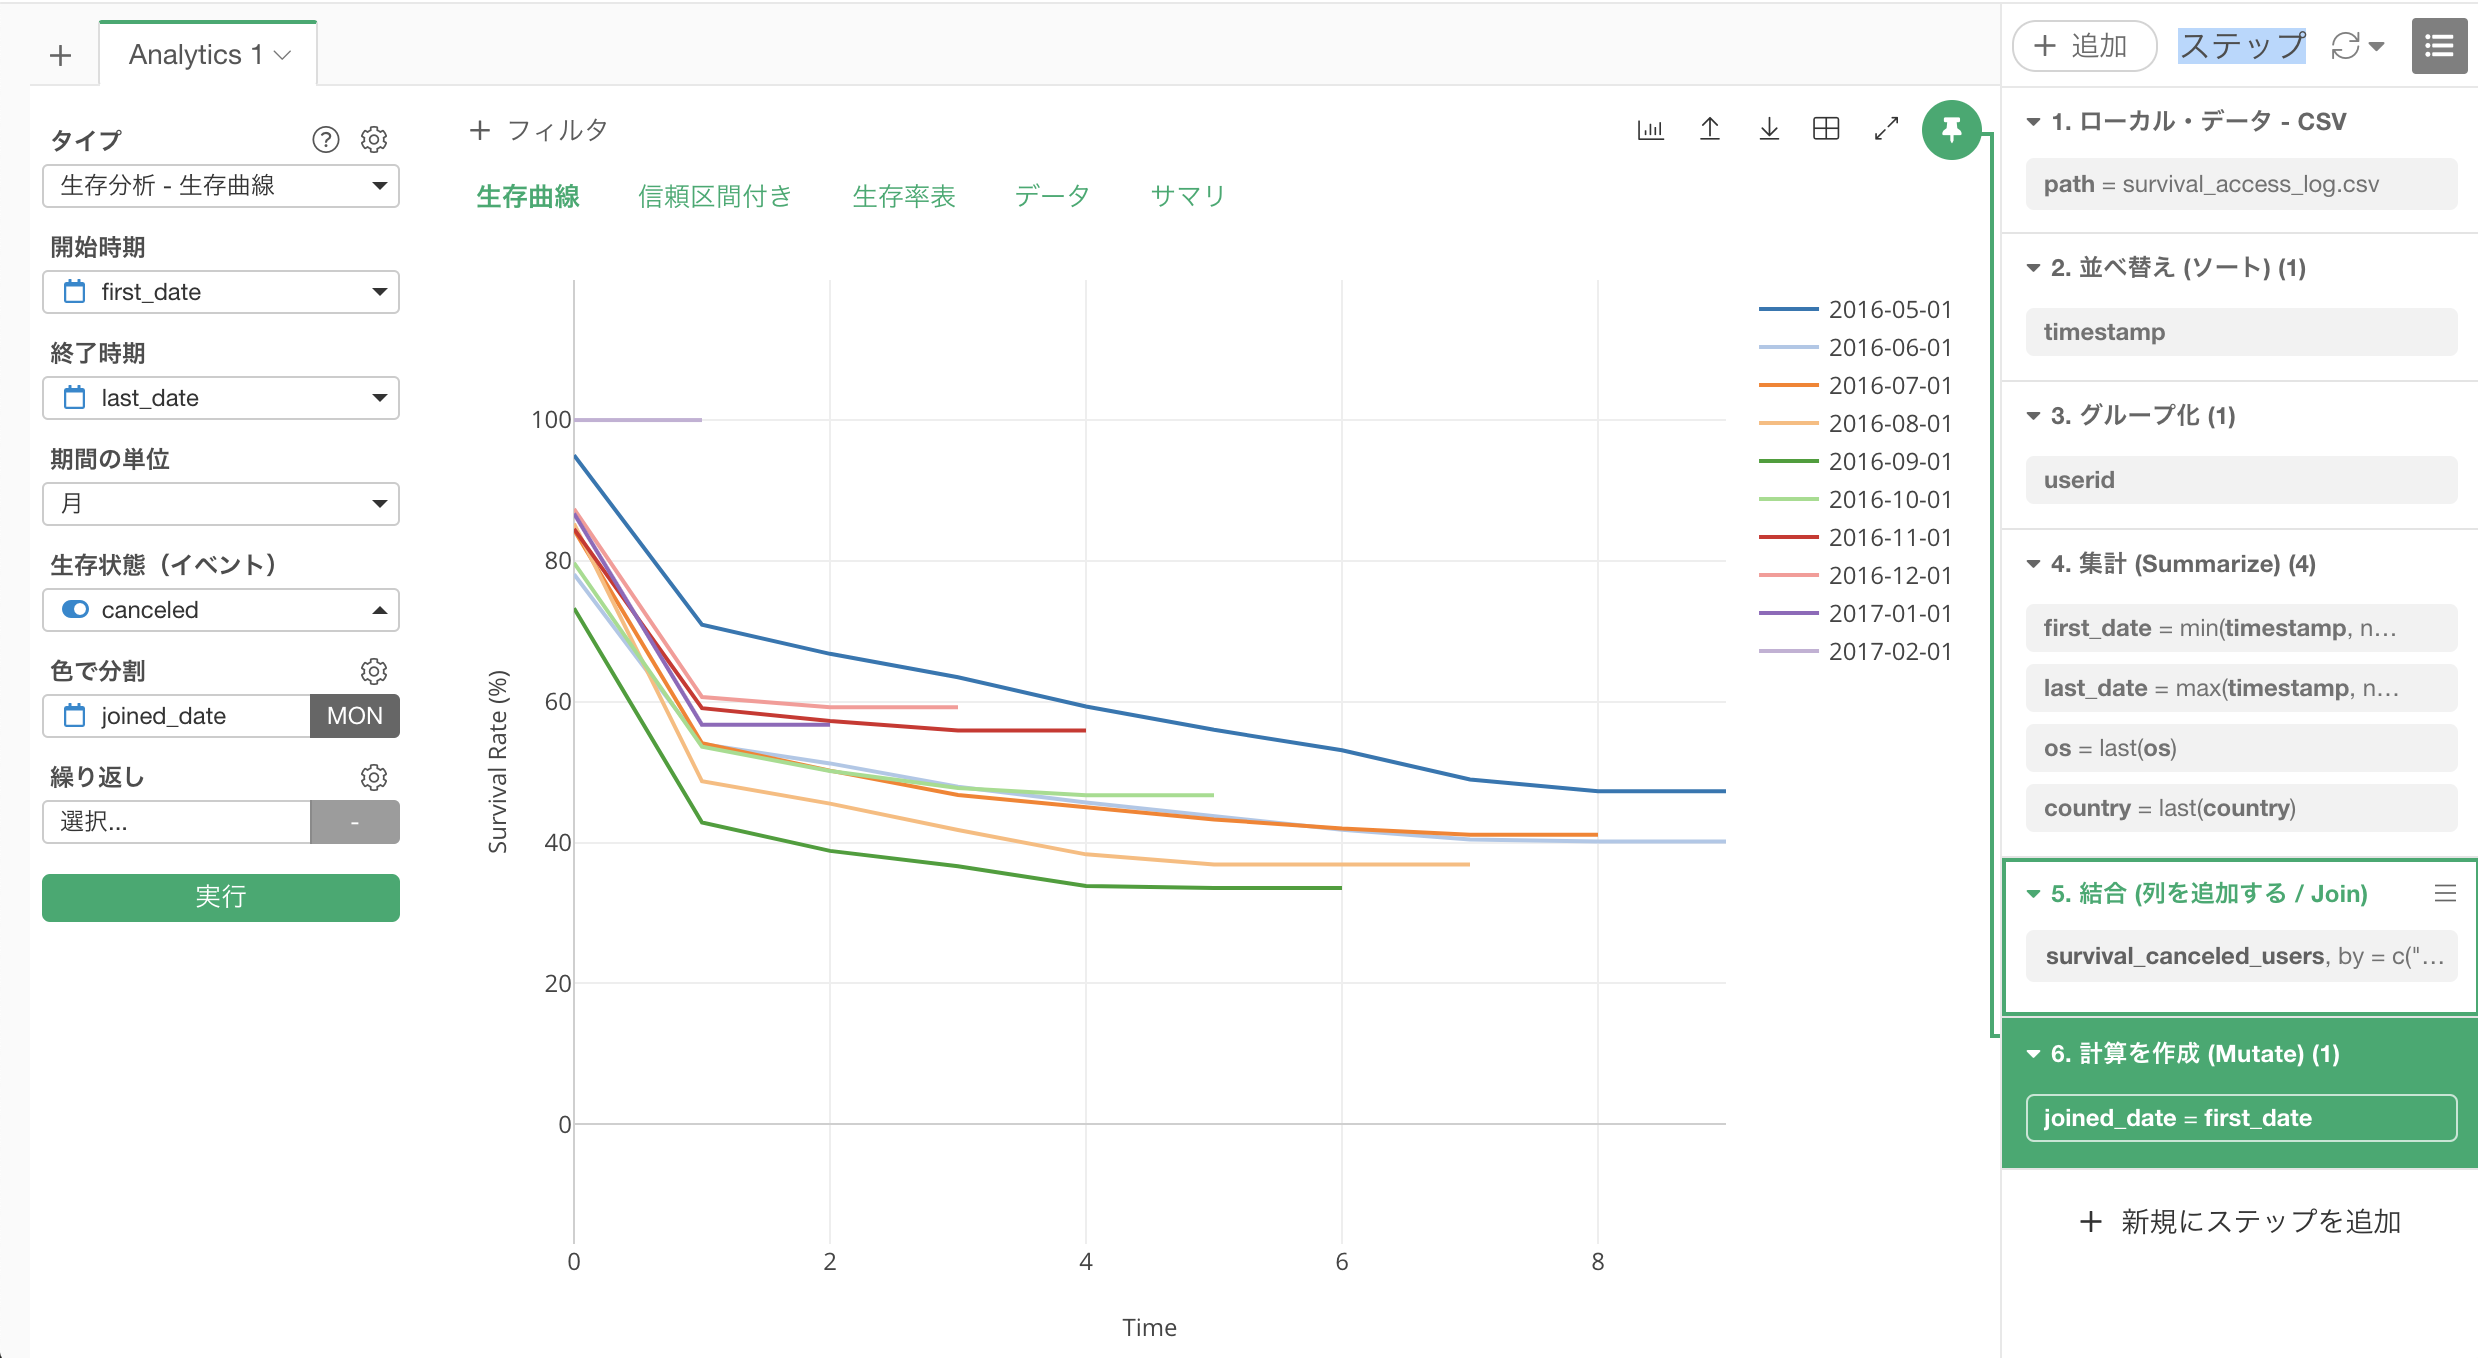
ステップを見ると
- アクセスログのデータ読み込む
- 時系列で並べ替える
- ユーザでグルーピングする
- 集計する
- ユーザがもう辞めているかどうかを判定できるようにする
- 計算する
なるほどね...

つくったもの
使ったパッケージ
- github.com/gocarina/gocsv
- CSVを読み込んで、Structureに設定してくれる。
- 標準パッケージで同じ事やったら面倒
- github.com/usk81/tiff
- 自作
- 2つの時間差を計算してくれるパッケージ
- gonum.org/v1/plot
- Plotのデータを渡すとグラフを作って画像出力してくれます
使ったデータ
データサイエンティストブートキャンプに参加したときに使ったデータを使いました。
使ったデータは作ったプログラムと一緒にgithubに上げています
- survival_access_log.csv
- ユーザのアクセスログ
- survival_canceled_users.csv
- ユーザが退会してるかどうかの判定
実際のプログラム
datetime.go
package main

import "time"

type DateTime struct {
    time.Time
}

// MarshalCSV Converts the internal date as CSV string
func (date *DateTime) MarshalCSV() (string, error) {
    return date.Time.Format(time.RFC3339), nil
}

// You could also use the standard Stringer interface
func (date *DateTime) String() string {
    return date.String() // Redundant, just for example
}

// UnmarshalCSV Converts the CSV string as internal date
func (date *DateTime) UnmarshalCSV(csv string) (err error) {
    date.Time, err = time.Parse(time.RFC3339, csv)
    return err
}
main.go
package main

import (
    "fmt"
    "image/color"
    "math/rand"
    "os"
    "time"

    "github.com/gocarina/gocsv"
    "github.com/usk81/tiff"
    "gonum.org/v1/plot"
    "gonum.org/v1/plot/plotter"
    "gonum.org/v1/plot/vg"
    "gonum.org/v1/plot/vg/draw"
)

type accessLog struct {
    Timestamp DateTime `csv:"timestamp"`
    UserID    string   `csv:"userid"`
    OS        string   `csv:"os"`
    Contry    string   `csv:"contry"`
}

type user struct {
    UserID   string `csv:"userid"`
    Canceled string `csv:"canceled"`
}

type data struct {
    UserID    string
    FirstDate time.Time
    LastDate  time.Time
    JoinMonth string
    Months    int
    Canceled  bool
}

type summary struct {
    Total int
    Data  []int
}

type monthly struct {
    JoinDate time.Time
}

const location = "Asia/Tokyo"

func init() {
    loc, err := time.LoadLocation(location)
    if err != nil {
        loc = time.FixedZone(location, 9*60*60)
    }
    time.Local = loc
}

func main() {
    // load survival_access_log
    lg := []*accessLog{}
    if err := loadCSVFile("survival_access_log.csv", &lg); err != nil {
        panic(err)
    }

    us := []*user{}
    if err := loadCSVFile("survival_canceled_users.csv", &us); err != nil {
        panic(err)
    }

    // group by user
    groupedLogs := map[string]data{}
    for _, v := range lg {
        if v == nil {
            continue
        }
        tt := time.Date(
            v.Timestamp.Time.Year(),
            v.Timestamp.Time.Month(),
            1,
            0,
            0,
            0,
            0,
            time.Local,
        )
        g, ok := groupedLogs[v.UserID]
        if ok {
            if g.FirstDate.After(tt) {
                g.FirstDate = tt
                g.JoinMonth = tt.Format("2006-01")
                g.Months = tiff.New(g.FirstDate, g.LastDate).Months()
            } else if g.LastDate.Before(tt) {
                g.LastDate = tt
                g.Months = tiff.New(g.FirstDate, g.LastDate).Months()
            }
        } else {
            // create summary data
            g = data{
                UserID:    v.UserID,
                FirstDate: tt,
                LastDate:  tt,
                JoinMonth: tt.Format("2006-01"),
                Months:    0,
            }

            // join survival_canceled_users
            for _, u := range us {
                if u != nil && u.UserID == v.UserID {
                    g.Canceled = (u.Canceled == "TRUE")
                    break
                }
            }
        }
        groupedLogs[v.UserID] = g
    }

    // group by join date
    summaries := map[string]summary{}
    for _, l := range groupedLogs {
        s, ok := summaries[l.JoinMonth]
        if ok {
            d := s.Data
            for i := 0; i <= l.Months; i++ {
                if len(d)-1 < i {
                    d = append(d, 1)
                } else {
                    d[i]++
                }
            }
            s.Data = d
        } else {
            d := []int{}
            for i := 0; i <= l.Months; i++ {
                fmt.Printf("%s : %s\n", l.FirstDate.Format("2006-01"), l.LastDate.Format("2006-01"))
                if l.FirstDate.Format("2006-01") == l.LastDate.Format("2006-01") {
                    d = append(d, 0)
                } else {
                    d = append(d, 1)
                }
            }
            s.Data = d
        }
        s.Total++
        summaries[l.JoinMonth] = s
    }

    // Create Plot
    p, err := plot.New()
    if err != nil {
        panic(err)
    }

    p.Title.Text = "Survival Analysis"
    p.X.Label.Text = "Time"
    p.Y.Label.Text = "Survival Rate (%)"

    for k, s := range summaries {
        pts := make(plotter.XYs, len(s.Data))
        ft := float64(s.Total)
        for i, d := range s.Data {
            pts[i].X = float64(i)
            pts[i].Y = (float64(d) / ft) * 100

        }
        rand.Seed(time.Now().UnixNano())
        ri := rand.Intn(255)
        ll, lp, _ := plotter.NewLinePoints(pts)
        rbga := color.RGBA{R: uint8(255 - ri), B: uint8(128 - ri), A: uint8(ri)}
        ll.Color = rbga
        lp.Shape = draw.CircleGlyph{}
        lp.Color = rbga
        p.Add(ll, lp)
        p.Legend.Add(k, ll, lp)
    }

    // Save the plot to a PNG file.
    if err = p.Save(10*vg.Inch, 10*vg.Inch, "points.png"); err != nil {
        panic(err)
    }
}

func loadCSVFile(fp string, v interface{}) (err error) {
    f, err := os.OpenFile(fp, os.O_RDWR|os.O_CREATE, os.ModePerm)
    if err != nil {
        return
    }
    defer f.Close()
    return gocsv.UnmarshalFile(f, v)
}
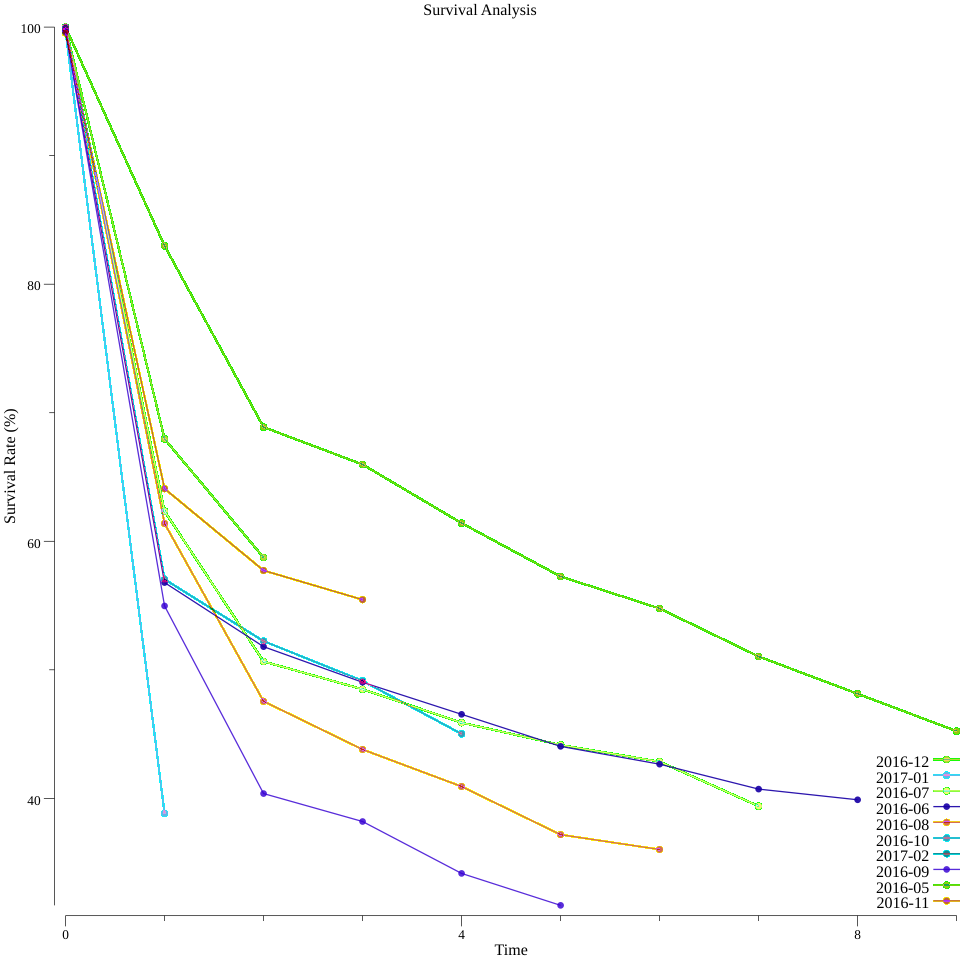
結果
なんか違うw
多分、0ヶ月目の計算がうまく行ってないのと、計算方法が少し違いそうです。
でも生存曲線はGoでも描けそうなことはわかりました
後記
よっぽどのことがない限りは今のところはGoで統計分析っぽいことはやめたほうがよさそう。
とても大変です