はじめに
こんな方にオススメ。
・ランダムフォレストを使用した分類のサンプルソースがほしい
・ランダムフォレストを使用した重要度評価のサンプルソースがほしい
ソース
分類
目的変数と説明変数の分類した正解率を算出
import numpy as np
import pandas as pd
import matplotlib.pyplot as plt
from sklearn.ensemble import RandomForestClassifier
from sklearn.model_selection import train_test_split
from sklearn.datasets import load_iris

# データセット読み込み
iris = load_iris()
df = pd.DataFrame(iris.data, columns=iris.feature_names)
x = iris.data
y = iris.target

# 学習データとテストデータに分割
x_train, x_test, y_train, y_test = train_test_split(x, y)

# ランダムフォレストのモデル構築
# n_jobs : 全てのコアを使用(-1)
# n_estimators : 使用する決定木数(デフォルト10)
model = RandomForestClassifier(n_estimators=20,n_jobs=-1)
model.fit(x_train, y_train)

#正解率
print ("正解率",model.score(x_test,y_test))

#予測データ作成
y_pre = model.predict(x_train)

fig = plt.figure(figsize=(14,7))
ax = fig.add_subplot(111)
ax.scatter(2,2,color="white")
ax.plot(y_train,lw=1,color="red",label="train")
ax.plot(y_pre,lw=1,color="blue",label="predict")
ax.legend()
fig.show()
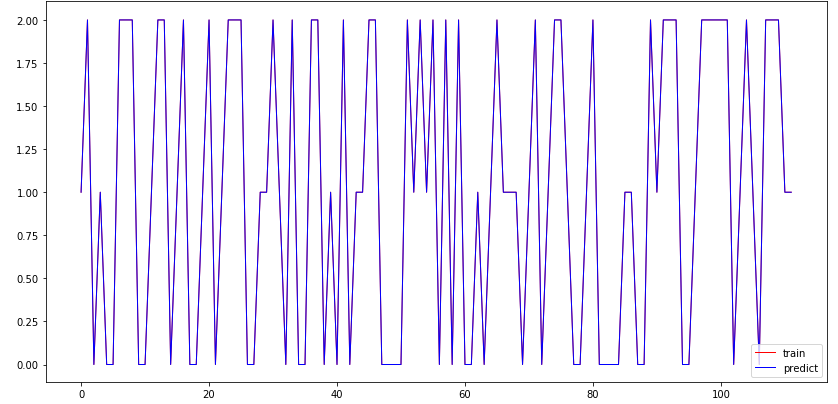
訓練データ(赤)と予測データ(青)の乖離が少ないことをグラフ化
重要度評価
目的変数に対する説明変数の重要度を算出。
import numpy as np
import pandas as pd
import matplotlib.pyplot as plt
from sklearn.ensemble import RandomForestClassifier
from sklearn.model_selection import train_test_split
from sklearn.datasets import load_iris

# データセット読み込み
iris = load_iris()
df = pd.DataFrame(iris.data, columns=iris.feature_names)
x = iris.data
y = iris.target

# 学習データとテストデータに分割
x_train, x_test, y_train, y_test = train_test_split(x, y)

# ランダムフォレストのモデル構築
# n_jobs : 全てのコアを使用(-1)
# n_estimators : 使用する決定木数(デフォルト10)
model = RandomForestClassifier(n_estimators=20,n_jobs=-1)
model.fit(x_train, y_train)

#特徴量の重要度
feature = model.feature_importances_
#特徴量の名前
label = df.columns[0:]
#特徴量の重要度順(降順)
indices = np.argsort(feature)[::1]

# プロット
x = range(len(feature))
y = feature[indices]
y_label = label[indices]
plt.barh(x, y, align = 'center')
plt.yticks(x, y_label)
plt.xlabel("importance_num")
plt.ylabel("label")
plt.show()
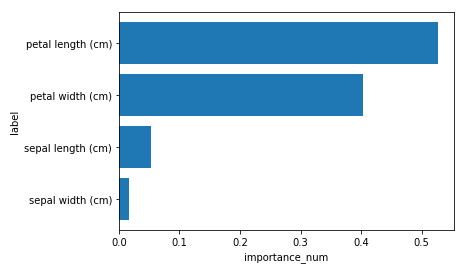
目的変数に対する説明変数の特徴量を降順でグラフ化。
GitHub
上記実装したipynbファイルは以下に格納しております。
https://github.com/bossjerom/python/tree/master/randam_forest