
The Firefox DevTools team and our contributors were hard at work over the summer, getting Firefox 70 jam-packed with improvements. We are especially excited about our new WebSocket inspection feature, because you told us in feedback how important it would be for your daily work. The WebSocket inspector will be released in Firefox 71, but is ready for you to use in Firefox Developer Edition now.
To use the inspector now, download Firefox Developer Edition, open DevTools’ Network panel to find the Messages tab. Then, keep reading to learn more about WebSockets and the tricks that the new panel has up its sleeve.
But first, big thanks to Heng Yeow Tan, the Google Summer of Code (GSoC) student who’s responsible for the implementation.
A Primer on WebSockets
We use the WebSocket (WS) API to create a persistent connection between a client and server. Because the API sends and receives data at any time, it is used mainly in applications requiring real-time communication.
Although it is possible to work directly with the WS API, some existing libraries come in handy and help save time. These libraries can help with connection failures, proxies, authentication and authorization, scalability, and much more. The WS inspector in Firefox DevTools currently supports Socket.IO and SockJS, but more support is in the works.
Want to learn more about how to set up WebSocket for your client applications? Head over to MDN’s guides. In the meantime, let’s dive into the new feature.
Getting started with the WebSocket Inspector
The WebSocket Inspector is part of the existing Network panel UI in DevTools. It’s already possible to filter the content for opened WS connections in this panel, but till now there was no chance to see the actual data transferred through WS frames.
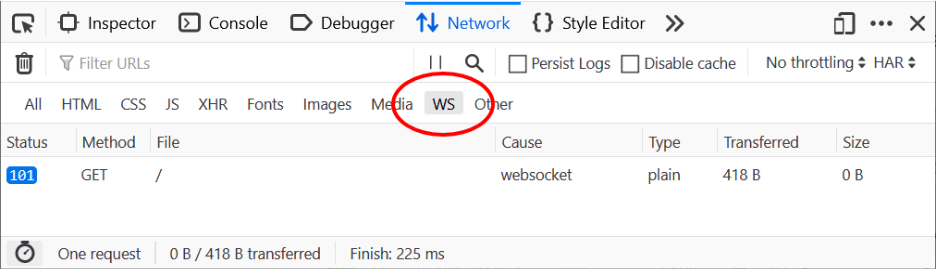
The following screenshot shows the WS filter in action. Only the 101 request (WebSocket Protocol Handshake) is visible. The response code indicates that the server is switching to WS connection.
Clicking on the 101 request opens the familiar sidebar, showing details about the selected HTTP request. In addition, the UI now offers a fresh new Messages panel that can be used to inspect WS frames sent and received through the selected WS connection.
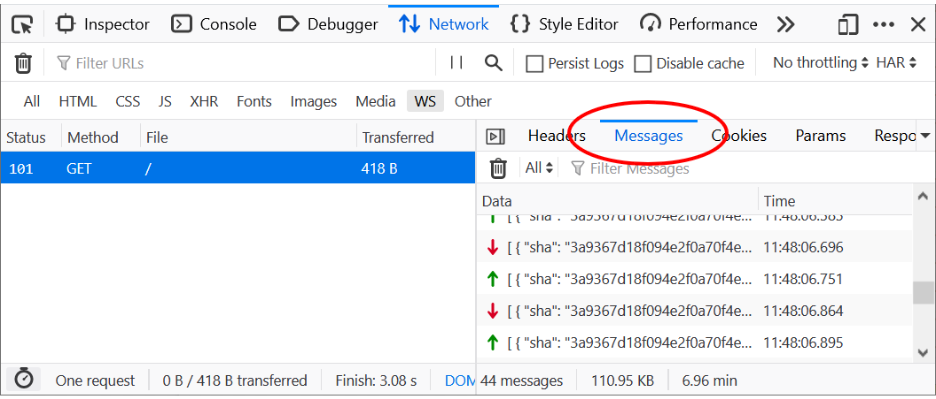
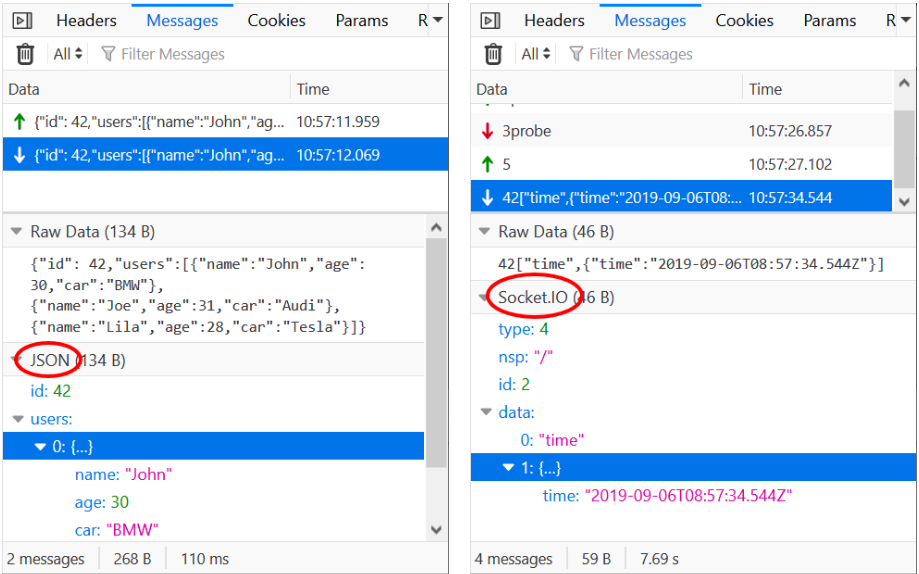
The live-updated table shows data for sent (green arrow) and received (red arrow) WS frames. Each frame expands on click, so you can inspect the formatted data.
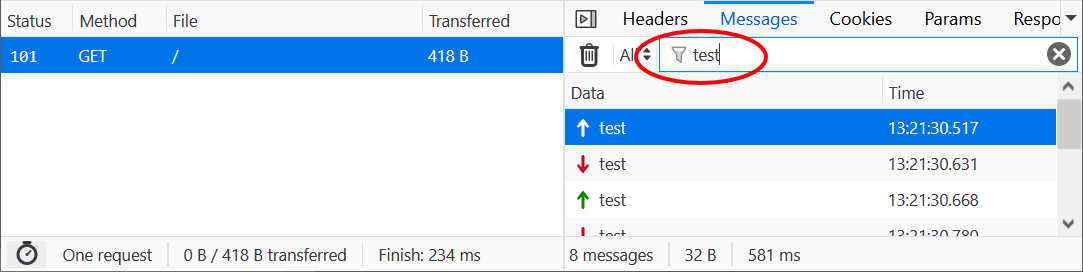
To focus on specific messages, frames can be filtered free text.
The Data and Time columns are visible by default, but you can customize the interface to see more columns by right-clicking on the header.
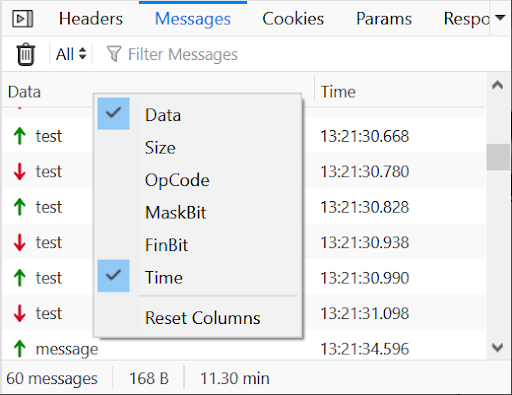
Selecting a frame in the list shows a preview at the bottom of the Messages panel.

The inspector currently supports the following WS protocols – and we have more planned:
-
- Plain JSON
- Socket.IO
- SockJS
- Coming soon
- SignalR
- WAMP
Payload based on those protocols is parsed and displayed as an expandable tree for easy inspection. Of course, you can still see the raw data (as sent over the wire) as well.
Use the pause/resume button in the Network panel toolbar to stop intercepting WS traffic. This allows you to capture only the frames that you are interested in.

What’s next for the WebSockets inspector
We wanted to release this initial feature set quickly to let you use it. We have a few things that we are still working on for upcoming releases:
- Binary payload viewer
- Indicating closed connections
- More protocols like SignalR and WAMP (and making it extensible)
- Exporting WS frames (as part of HAR)
- See our backlog for more of what’s coming
We would love your feedback on the new WebSocket Inspector, which is available now in Firefox Developer Edition 70. It will be released in Firefox 71, to include some of your feedback and bugfixes. If you haven’t had a chance yet, install and open Developer Edition, then follow along with this post to master WebSocket debugging.
About Jan Honza Odvarko
Honza is working on Firefox Developer Tools
More articles by Jan Honza Odvarko…
About Harald Kirschner (digitarald)
Harald "digitarald" Kirschner is a Product Manager for Firefox's Developer Experience and Tools – striving to empower creators to code, design & maintain a web that is open and accessible to all. During his 8 years at Mozilla, he has grown his skill set amidst performance, web APIs, mobile, installable web apps, data visualization, and developer outreach projects.
11 comments