Tracking PG&E outages by scraping to a git repo
10th October 2019
PG&E have cut off power to several million people in northern California, supposedly as a precaution against wildfires.
As it happens, I’ve been scraping and recording PG&E’s outage data every 10 minutes for the past 4+ months. This data got really interesting over the past two days!
The original data lives in a GitHub repo (more importantly in the commit history of that repo).
Reading JSON in a Git repo isn’t particularly productive, so this afternoon I figured out how to transform that data into a SQLite database and publish it with Datasette.
The result is pge-outages.simonwillison.net
The data model: outages and snapshots
The three key tables to understand are outages, snapshots and outage_snapshots.
PG&E assign an outage ID to every outage—where an outage is usually something that affects a few dozen customers. I store these in the outages table.
Every 10 minutes I grab a snapshot of their full JSON file, which reports every single outage that is currently ongoing. I store a record of when I grabbed that snapshot in the snapshots table.
The most interesting table is outage_snapshots. Every time I see an outage in the JSON feed, I record a new copy of its data as an outage_snapshot row. This allows me to reconstruct the full history of any outage, in 10 minute increments.
Here are all of the outages that were represented in snapshot 1269—captured at 4:10pm Pacific Time today.
I can run select sum(estCustAffected) from outage_snapshots where snapshot = 1269 (try it here) to count up the total PG&E estimate of the number of affected customers—it’s 545,706!
I’ve installed datasette-vega which means I can render graphs. Here’s my first attempt at a graph showing the number of estimated customers affected over time.
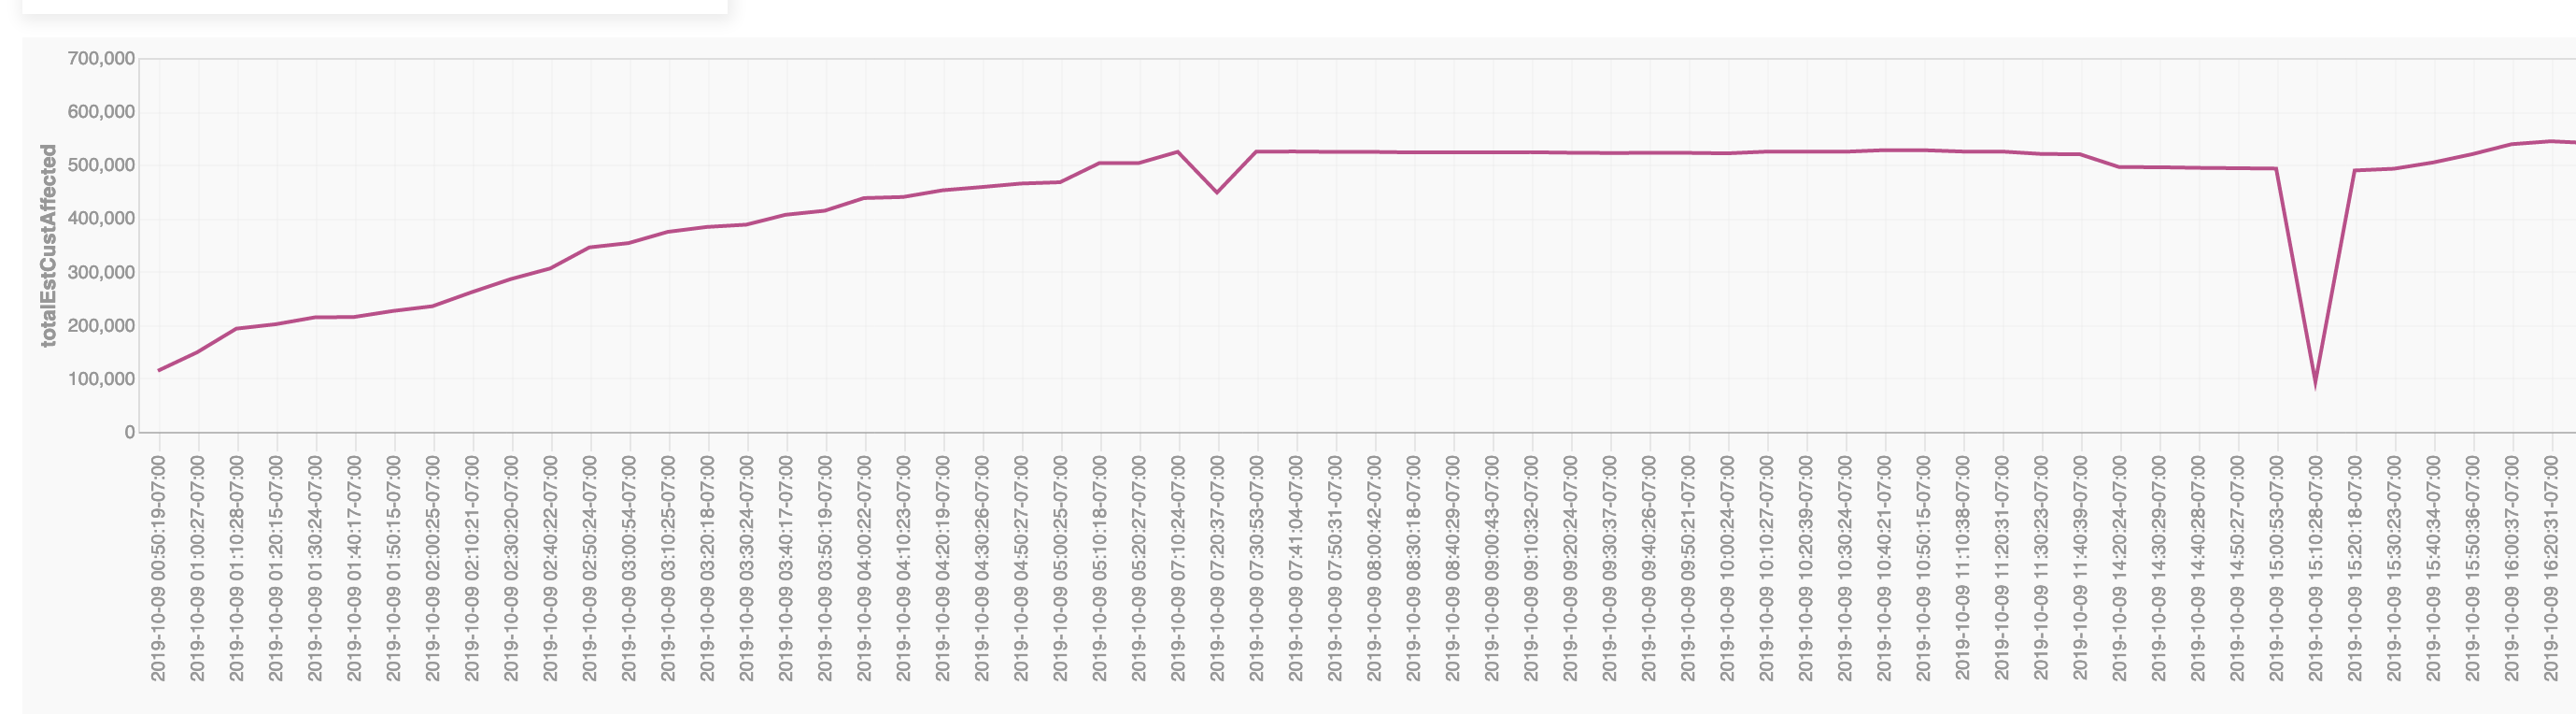
(I don’t know why there’s a dip towards the end of the graph).
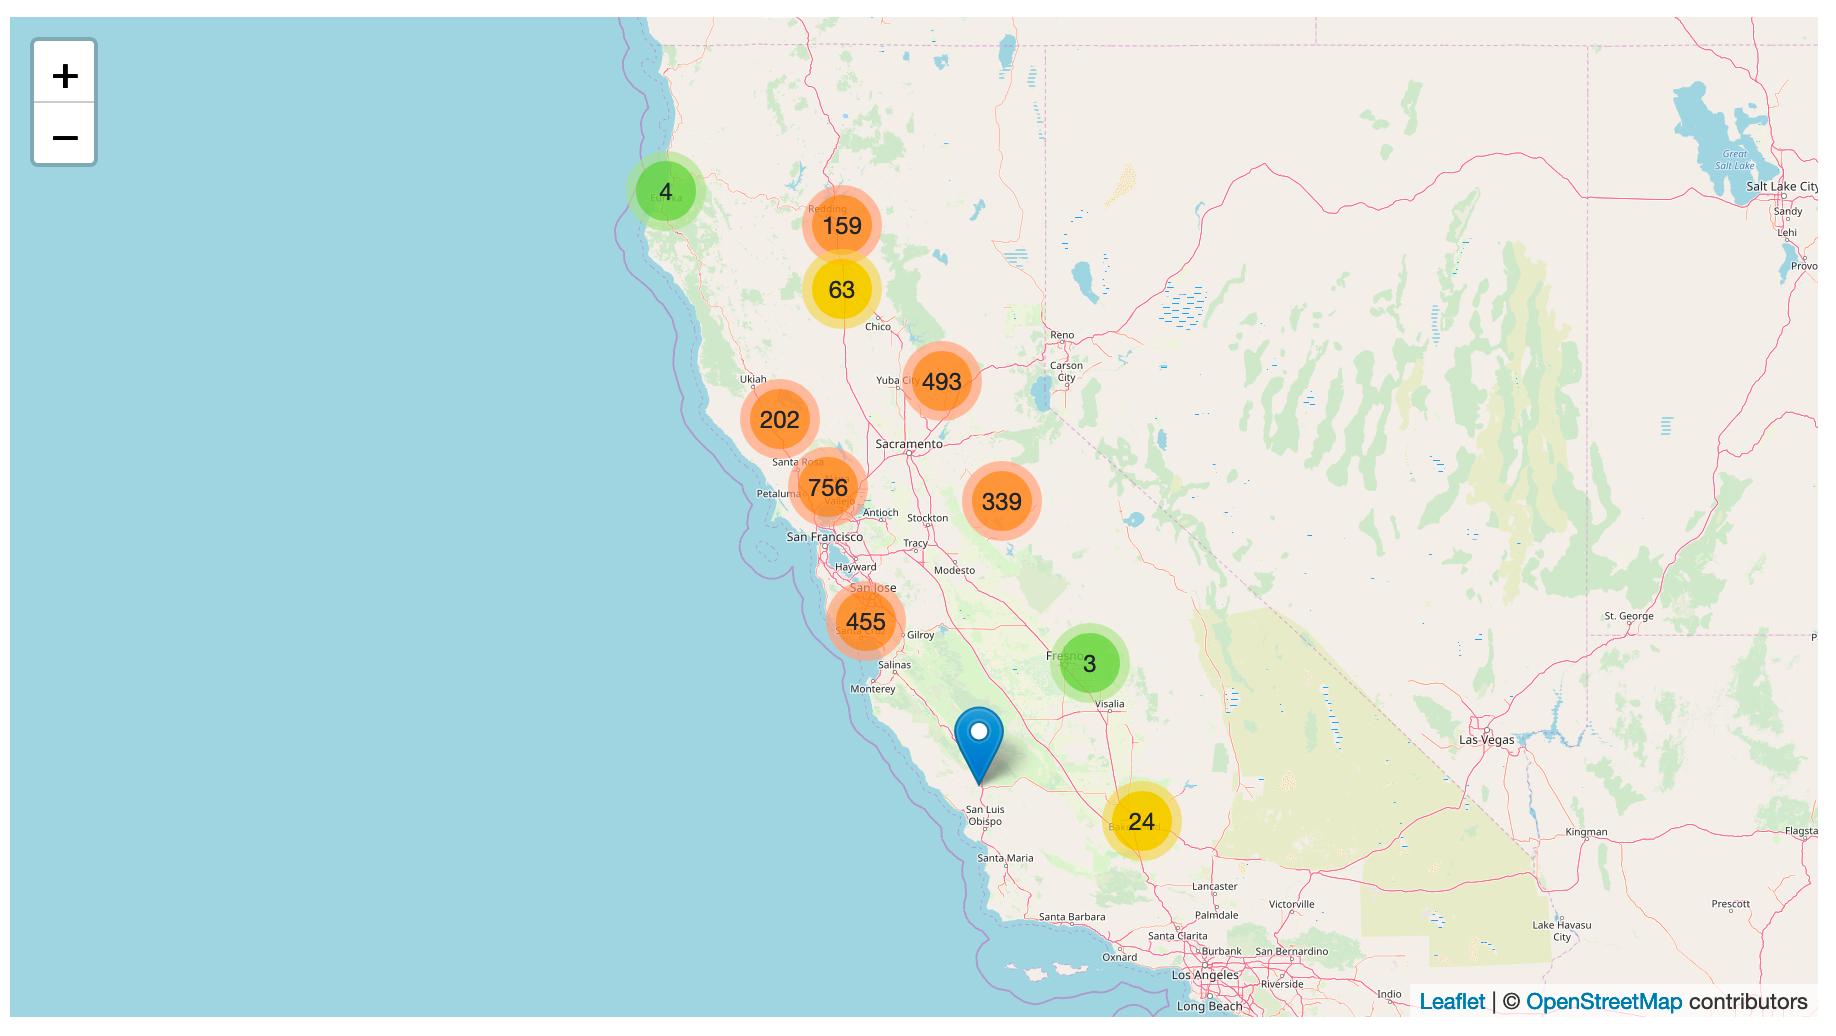
I also defined a SQL view which shows all of the outages from the most recently captured snapshot (usually within the past 10 minutes if the PG&E website hasn’t gone down) and renders them using datasette-cluster-map.
Things to be aware of
There are a huge amount of unanswered questions about this data. I’ve just been looking at PG&E’s JSON and making guesses about what things like estCustAffected means. Without official documentation we can only guess as to how accurate this data is, or how it should be interpreted.
Some things to question:
- What’s the quality of this data? Does it reflect accurately on what’s actually going on out there?
- What’s the exact meaning of the different columns—
estCustAffected,currentEtor,autoEtor,hazardFlagetc? - Various columns (
lastUpdateTime,currentEtor,autoEtor) appear to be integer unix timestamps. What timezone were they recorded in? Do they include DST etc?
How it works
I originally wrote the scraper back in October 2017 during the North Bay fires, and moved it to run on Circle CI based on my work building a commit history of San Francisco’s trees.
It’s pretty simple: every 10 minutes a Circle CI job runs which scrapes the JSON feed that powers the PG&E website’s outage map.
The JSON is then committed to my pge-outages GitHub repository, over-writing the existing pge-outages.json file. There’s some code that attempts to generate a human-readable commit message, but the historic data itself is saved in the commit history of that single file.
Building the Datasette
The hardest part of this project was figuring out how to turn a GitHub commit history of changes to a JSON file into a SQLite database for use with Datasette.
After a bunch of prototyping in a Jupyter notebook, I ended up with the schema described above.
The code that generates the database can be found in build_database.py. I used GitPython to read data from the git repository and my sqlite-utils library to create and update the database.
Deployment
Since this is a large database that changes every ten minutes, I couldn’t use the usual datasette publish trick of packaging it up and re-deploying it to a serverless host (Cloud Run or Heroku or Zeit Now) every time it updates.
Instead, I’m running it on a VPS instance. I ended up trying out Digital Ocean for this, after an enjoyable Twitter conversation about good options for stateful (as opposed to stateless) hosting.
Next steps
I’m putting this out there and sharing it with the California News Nerd community in the hope that people can find interesting stories in there and help firm up my methodology—or take what I’ve done and spin up much more interesting forks of it.
If you build something interesting with this please let me know, via email (swillison is my Gmail) or on Twitter.
More recent articles
- AI for Data Journalism: demonstrating what we can do with this stuff right now - 17th April 2024
- Three major LLM releases in 24 hours (plus weeknotes) - 10th April 2024
- Building files-to-prompt entirely using Claude 3 Opus - 8th April 2024
- Running OCR against PDFs and images directly in your browser - 30th March 2024
- llm cmd undo last git commit - a new plugin for LLM - 26th March 2024
- Building and testing C extensions for SQLite with ChatGPT Code Interpreter - 23rd March 2024
- Claude and ChatGPT for ad-hoc sidequests - 22nd March 2024
- Weeknotes: the aftermath of NICAR - 16th March 2024
- The GPT-4 barrier has finally been broken - 8th March 2024
- Prompt injection and jailbreaking are not the same thing - 5th March 2024