
Dynatrace has made it easier for you and your web performance-optimization engineers to access Visually complete metric findings for each page-load that is captured with Dynatrace Real User Monitoring. Visually complete measurements are easy to understand—they measure the amount of time it takes for the visible portion of a web application to fully render on your end-users’ device screens. Analyzing the Visually complete user experience metric helps you understand what can be done to improve your application’s end users’ above-the-fold experience. Optimizing your application for Visually complete, however, requires an in-depth understanding of web-page loading behavior. This is where Dynatrace Waterfall analysis is indispensable.
Visually complete findings now displayed in Waterfall analysis view
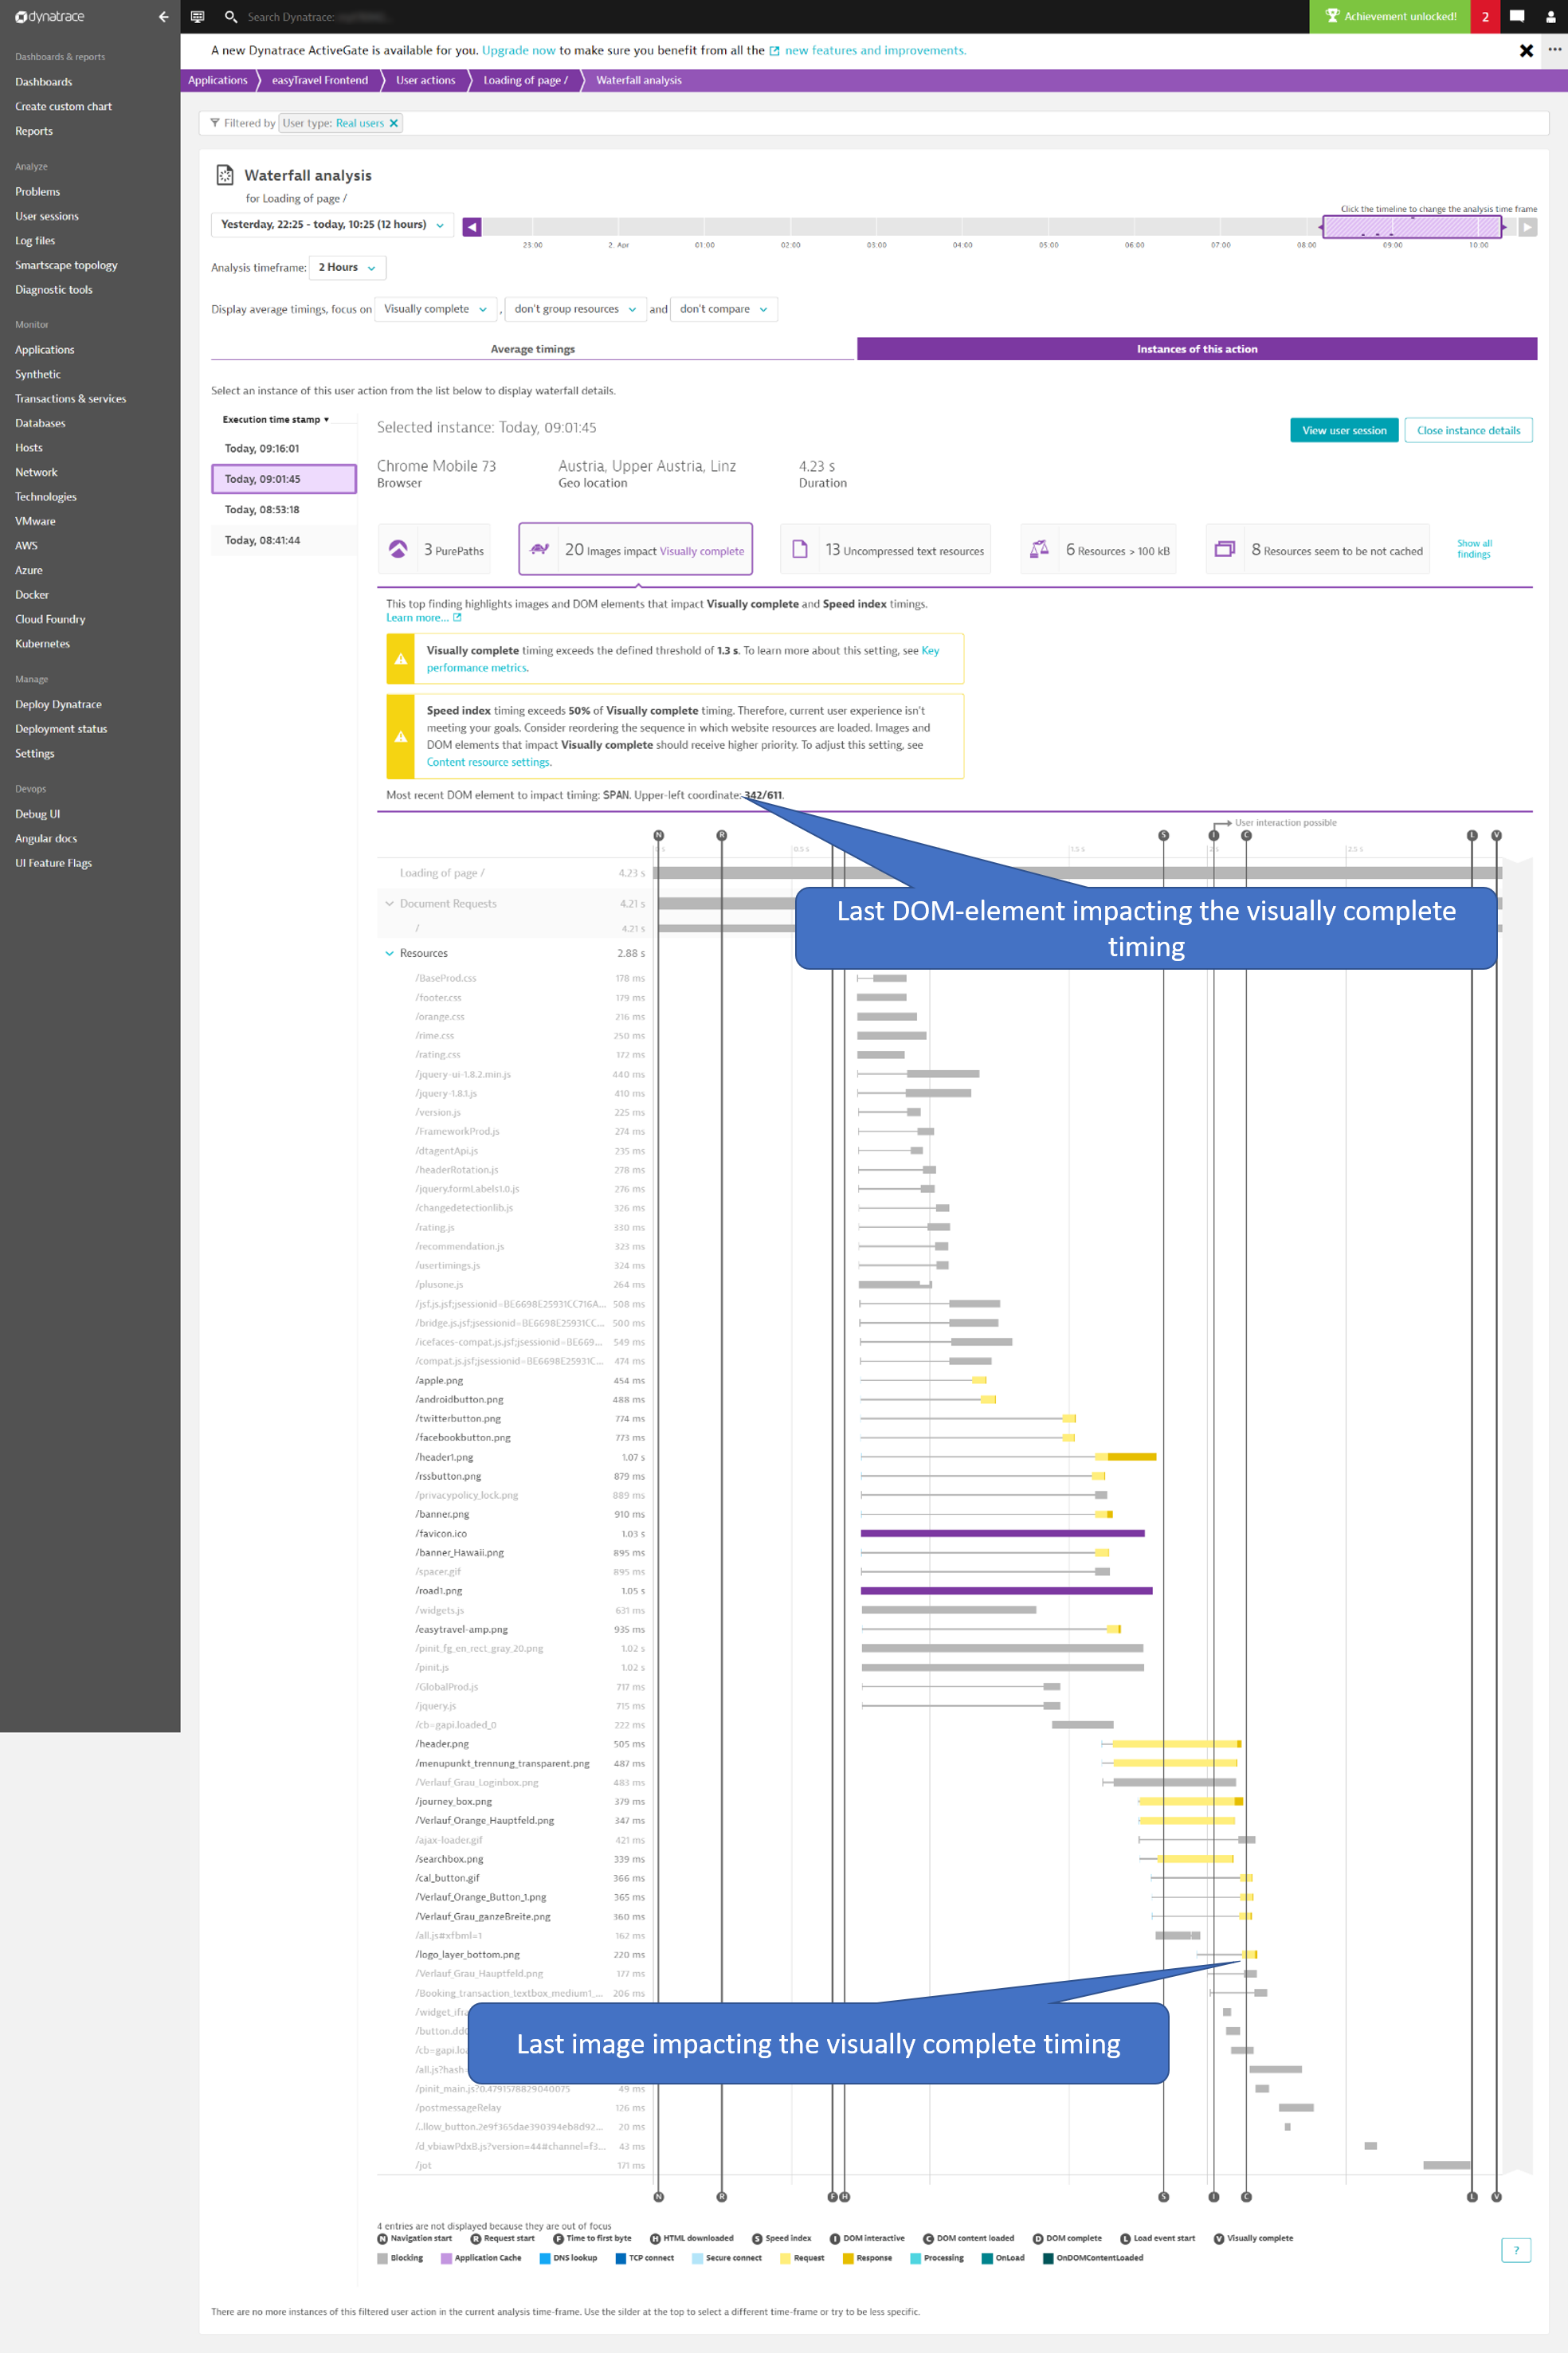
The new Visually complete top findings tile helps you focus your waterfall analysis on those page resources that impact above-the-fold user experience. It also gives you a quick indication as to whether or not any performance thresholds have been breached. On top you get the last DOM element (and a DOM-element identifier) impacting Visually complete timing for the waterfall captured on given the real device and display size. As you can see from the image below, CSS files and JavaScript files are not highlighted as impacting resources as this can’t be determined for sure. When you’re optimizing the above-the-fold area, you have to take a look at these resources as well as they can visibly change DOM elements that are not bound to a resource request. In the example below, a simple SPAN tag, not a resource, is causing the final trigger for Visually complete.
As you can see in the example below, top findings may also include warnings. Two warnings are displayed in this example. Explanations of these two finding types are detailed below the image.
Top finding #1: Visually complete (Apdex and Key performance metric violation)
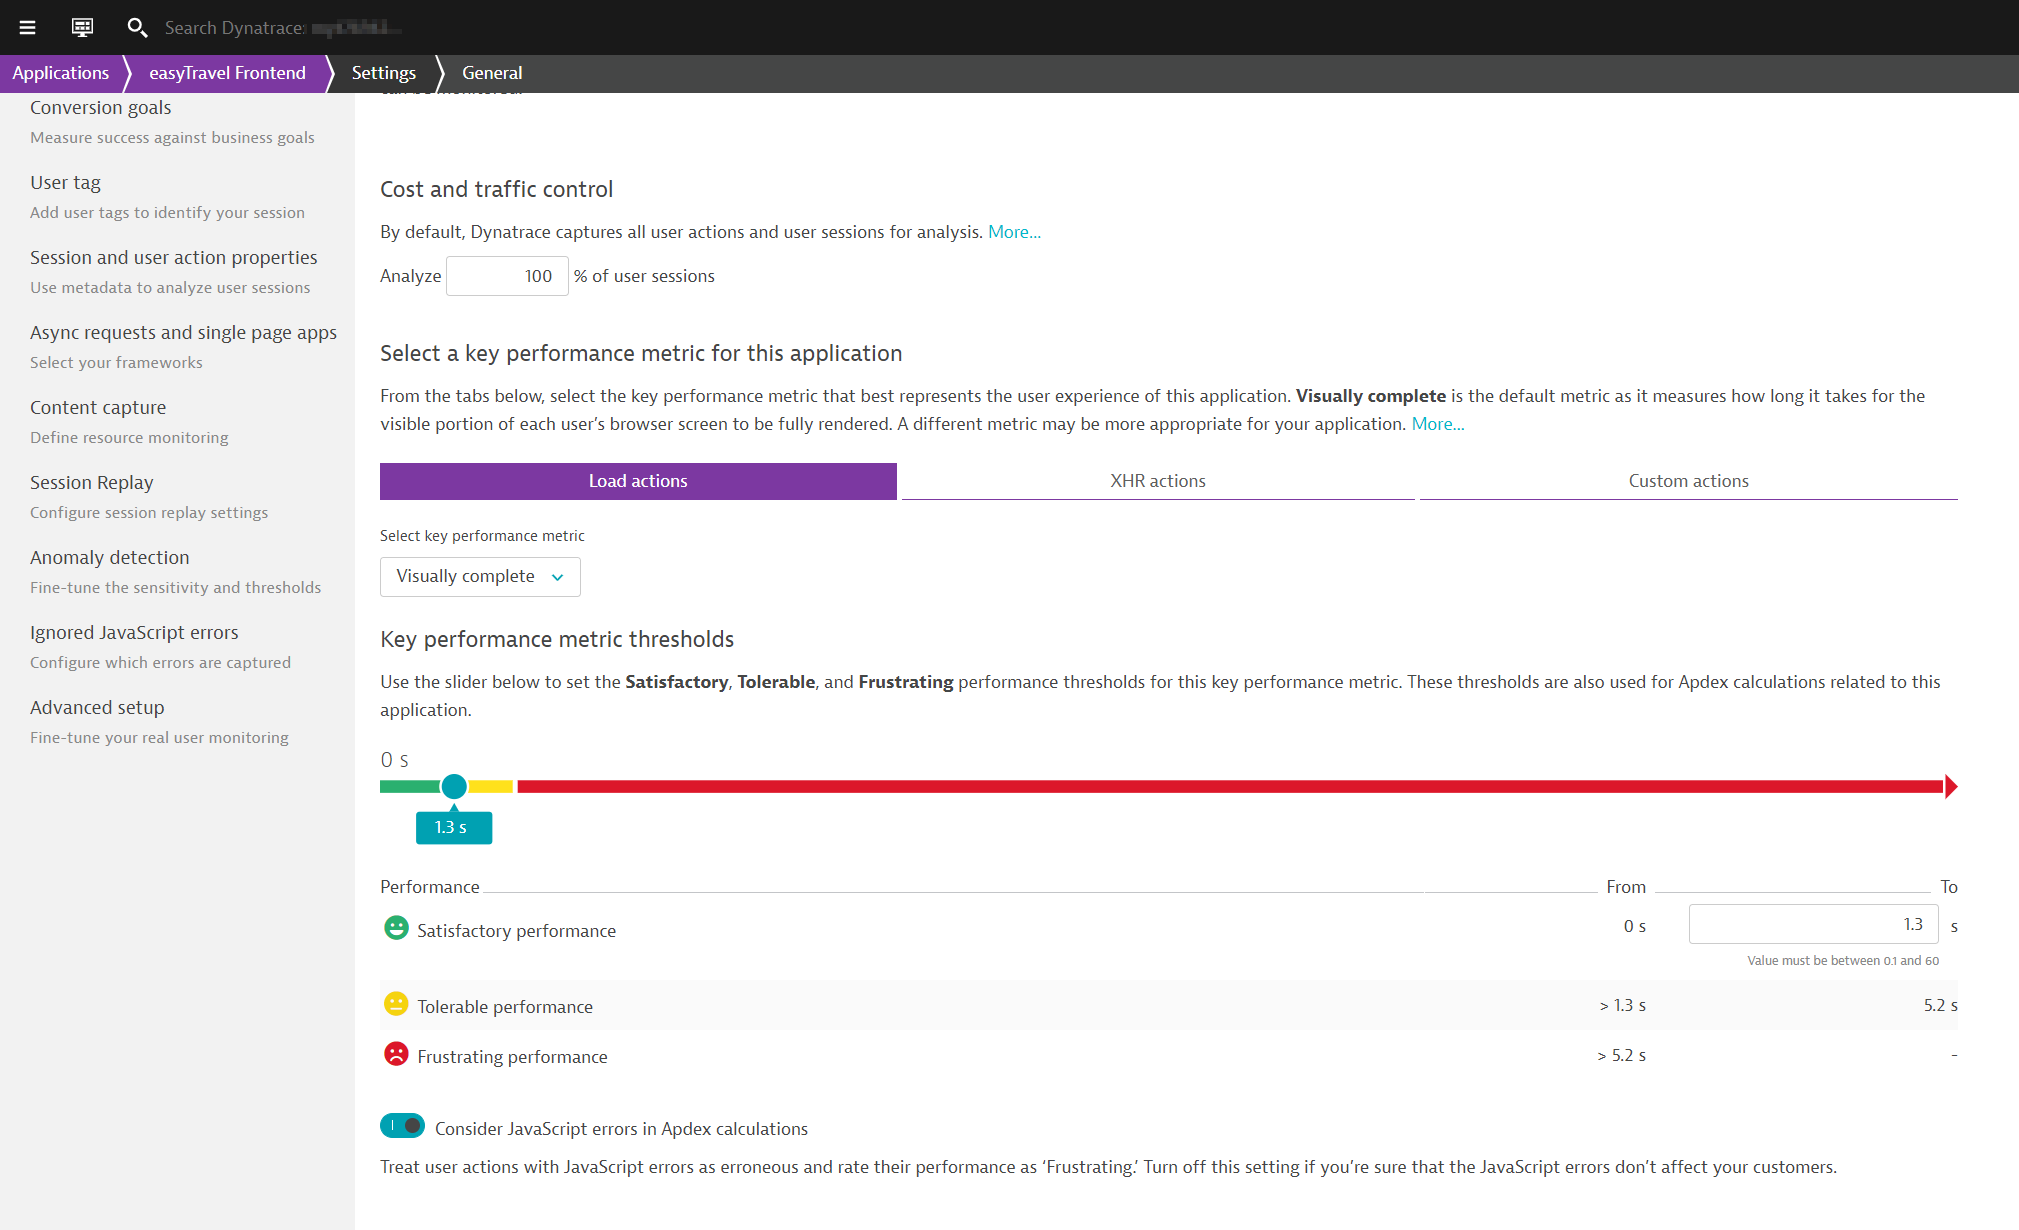
The first warning is driven by the threshold you’ve set for your application’s Key performance metric and Apdex. You can change this setting by navigating to the settings of this monitored application (see example below). Changing the threshold directly impacts not only the top findings but also the Apdex score calculation for the application across all Dynatrace views, including the World map, application overview, and elsewhere.
Top finding #2: Speed index exceeds a percentage of Visually complete timing
The second threshold is related to the Speed index and Visually complete metrics and how they relate to each other. Visually complete indicates when the area above-the-fold is fully rendered, whereas Speed index helps you to understand how quickly the largest areas of the screen are loading. The larger the difference between Speed index and Visually complete timing the better. To provide you with an easy indicator, Dynatrace warns you if Speed index is 50% or more of Visually complete. You can change this threshold as your performance improves and you need tighter restrictions.
Conclusion
Top findings for waterfalls help you understand the above-the-fold user experience of your real users. Initial page loads drive the first impressions of new visitors to your web application. Further, top findings provide an easy way of understanding which web requests impact key performance metrics and are therefore potential candidates for optimization.


Looking for answers?
Start a new discussion or ask for help in our Q&A forum.
Go to forum