How to Capture Data to Make Business Impact
We take a look at the formula for calculating the efficiency of a data capturing method, before going onto explain the concept of Smart Data.
Every business challenge that is to be solved with a data-driven decision has a data universe behind it. This data universe is the set of data that could be captured that is linked to the business challenge.

A data universe is formed by information and noise: Information is data that can be transformed into knowledge; noise is data from which no knowledge can be extracted (of course, noise data can also be treated and lead to “findings” which are false knowledge and not truly useful). Note that data being noise or information depends on the business challenge under discussion. In other words, the same datum could be noise in one business case and information in another.
It is also worth mentioning that nobody would collect noise data knowingly, i.e., noise data are utilized unwittingly. The reason is that differentiating noise and information could be very easy in some cases but not in others.
An example illustrates this well.
In the article Analítica Predictiva en La Liga Santander, prescriptive analytics were applied in the Spanish major soccer tournament to classify higher. Consider the historic data set of ice cream consumption in Madagascar: It would be next to common sense that this data has no relevance in this sports case so is clearly noise. But notice that only data from 1995 on is used. Indeed, there was data since 1975. So why the full record was not used? In the season 1995-1996, Spain adopted the rule of giving 3 points by won match instead of just 2. A Chow test was run to see if that affected the team’s behavior. And it tested positive. So, data from 1975 to 1994 was noise and not information. In this case, noticing it requested from a deep knowledge of the underlying field of study (and a bit of luck too).
Capturing noise has a side effect: the more noise we store, the more difficult it is to find information in the captured data. It is like a needle (information) in a haystack (noise). Even if we would easily tell the difference between a needle and thatch, it could be very difficult to recognize the needle if it is surrounded by a big amount of thatch. The Big Data rule-of-thumb of storing as much data as you can and for as large longitude as possible would be a false friend.
If we introduce a metric to quantify the efficiency of our data capturing efforts, it should follow these two rules:
- The more information we capture, the more efficient we are.
- The less noise we capture, the more efficient we are.
So, written in a formula it could look like this:

Rearranging the terms:
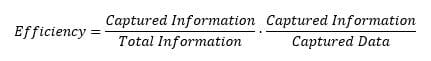
We could agree that (1) the more captured information we have, the more accurate we can be in our data treatments, and that (2) the less noise we capture, the more effective our data capturing efforts are. Substituting the terms, the equation would be as follows:
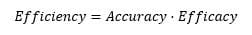
In the optimal case where all captured data is and only is information, Efficiency would take the value of 1. The value would be between 0 and 1 when some information and some noise is captured. And interestingly, Efficiency tends to be 0 as we try to capture all data from the data universe even if all information is contained in it.
Continuing with our example Analítica Predictiva en La Liga Santander, we could now calculate the efficiency of the data set used. The overall accuracy of the model was 91%. We could take this value as a proxy for the percentage of information captured. On the other hand, we know with certainty which data we used for the treatment from the total available. So, we could calculate it as follows:

Now that we have a definition for efficiency, we can introduce a new concept, Smart Data. In IoT, smart Data is often described as data coming from smart sensors. Some others define it as Big Data that has been cleansed, filtered, and prepared for analysis. There is no agreed definition for “Smart Data.” But I would like to define “smart data” as efficient data. The higher the efficiency, the smarter data is. Regardless of the source or cleaning process of the data, the highest efficiency (or “smartness”) of the data is 100%.
How can we make data capturing more efficient and only store Smart Data?
It is common to see Big Data initiatives as sequential by technology. Each task is independent and follows one another and finding the insights to solve the business challenge is the last task.
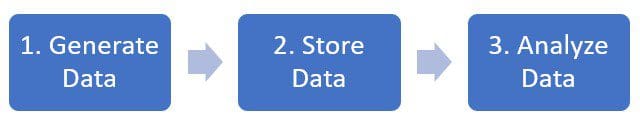
If there is no good communication between the parts, it is likely that not all the data generated will be information, which reduces Accuracy, and that not all the data stored will be information, which lowers Efficacy. This way, finding insights in the data is challenging and, as reported by Gartner, leads to a 60-85% failure rate of Big Data projects.
To optimize data capturing, any Big Data initiative must be an iterative process guided by the business needs. Different teams must communicate and collaborate closely to iteratively develop a solution around the business challenge. Bring in the analytics team early to help the IoT team capture data in the way that the data will be used. Separate information from noise in the existing data to improve Efficacy. Capture feasible data that the analytics team thought was unachievable and IoT team thought was irrelevant to increase Accuracy.
It is commonly said that data scientists spend 80% of their time cleaning data and only 20% analyzing it. With an efficient data capturing, Smart Data can rewrite the story where data scientists spend just 20% of their time cleaning data and 80% getting insights that truly makes a business impact.
Bio: Ramon Serrallonga is the Chief Data Officer of Cadifornia, Academic Assistant at ESADE Business & Law School, and Lecturer at EAE Business School. Economist, Master in Law, and MBA, his career has been developed in the intersection between business and technology.
Resources:
- On-line and web-based: Analytics, Data Mining, Data Science, Machine Learning education
- Software for Analytics, Data Science, Data Mining, and Machine Learning
Related:
- Overcoming distrust on the path to productive analytics
- Securing your future in big data
- Top Active Blogs on AI, Analytics, Big Data, Data Science, Machine Learning – updated