

[THE 2021 CLOUD REPORT IS AVAILABLE. READ IT HERE]
Note: As of December 20, 2018, we have updated two sections in this report: Network Throughput and I/O Experiment. The updates do not change the relative performance of either cloud — however, it does narrow the gap.
Our customers rely on us to help them navigate the complexities of the increasingly competitive cloud wars. Should they use Amazon Web Services (AWS)? Google Cloud Platform (GCP)? Microsoft Azure? How should they tune their workload for different offerings? Which is more reliable?
We are committed to building a cloud neutral product, and we run test clusters on all three leading US cloud providers. As we were testing features for our 2.1 release, we noticed something interesting: AWS offered 40% greater throughput than GCP.
We were curious as to why AWS offered such a stark difference in throughput, and set out to test the performance of GCP and AWS in more detail. Ultimately, we compared the two platforms on TPC-C performance (e.g., throughput and latency), CPU, network, I/O, and cost.
This inspired what has become the 2018 Cloud Report.
Our conclusion? AWS outperforms GCP on nearly every criteria we tested — including cost.
Note: We did not test Microsoft Azure due to limits on internal resources, but we plan to do so in the future.
Machine Types Tested in the 2018 Cloud Report
GCP has a variety of instance types (including standard and high CPU) but we focused on the n1-standard-16 machine with Intel Xeon Scalable Processor (Skylake) in the us-east region. We were familiar with this instance type as we used it to conduct our previous performance benchmarking.
A similar configuration isn’t quite as trivial as it sounds for AWS. AWS has more flavors of instances than GCP. It has the standard high CPU and general instances. We chose the latest compute-optimized AWS instance type, c5d.4xlarge instances, to match n1-standard-16, because they both have 16 cpus and SSDs (although AWS only offers 32 GB of RAM as compared to 60 GB of RAM on GCP) within the us-east-2 region.
For those readers not familiar with AWS, the first letter c corresponds to machine type; the number 5 is the generation; d corresponds to SSD; and the 4xlarge corresponds to CPU. Each of the most popular AWS machine types tested here varies the machine type, the generation, SSD or EBS, but not the CPU when evaluating AWS on TPC-C performance.
Experiments Run in the 2018 Cloud Report
We designed our experiment to first tease out whether or not AWS and GCP performance differed on a simulated customer workload. We started with a customer workload (and not micro-benchmarks) because it most directly simulates real-world customer behavior.
It was only after observing differences in applied workloads that we moved onto micro-benchmarks like CPU, network, and I/O performance. Differences in micro-benchmarks matter more when informed by the knowledge that the overall customer workload performance of the platforms differ. CPU, network, and I/O all represent separate hypothesis for why performance might vary between GCP and AWS.
TPC-C Performance
Note: these results were collected using nobarrier. See the "Why
nobarrierMatters" section below for a detailed explanation.
We chose to test workload performance by using TPC-C, a popular OLTP benchmark tool that simulates an e-commerce business, given our familiarity with this workload.
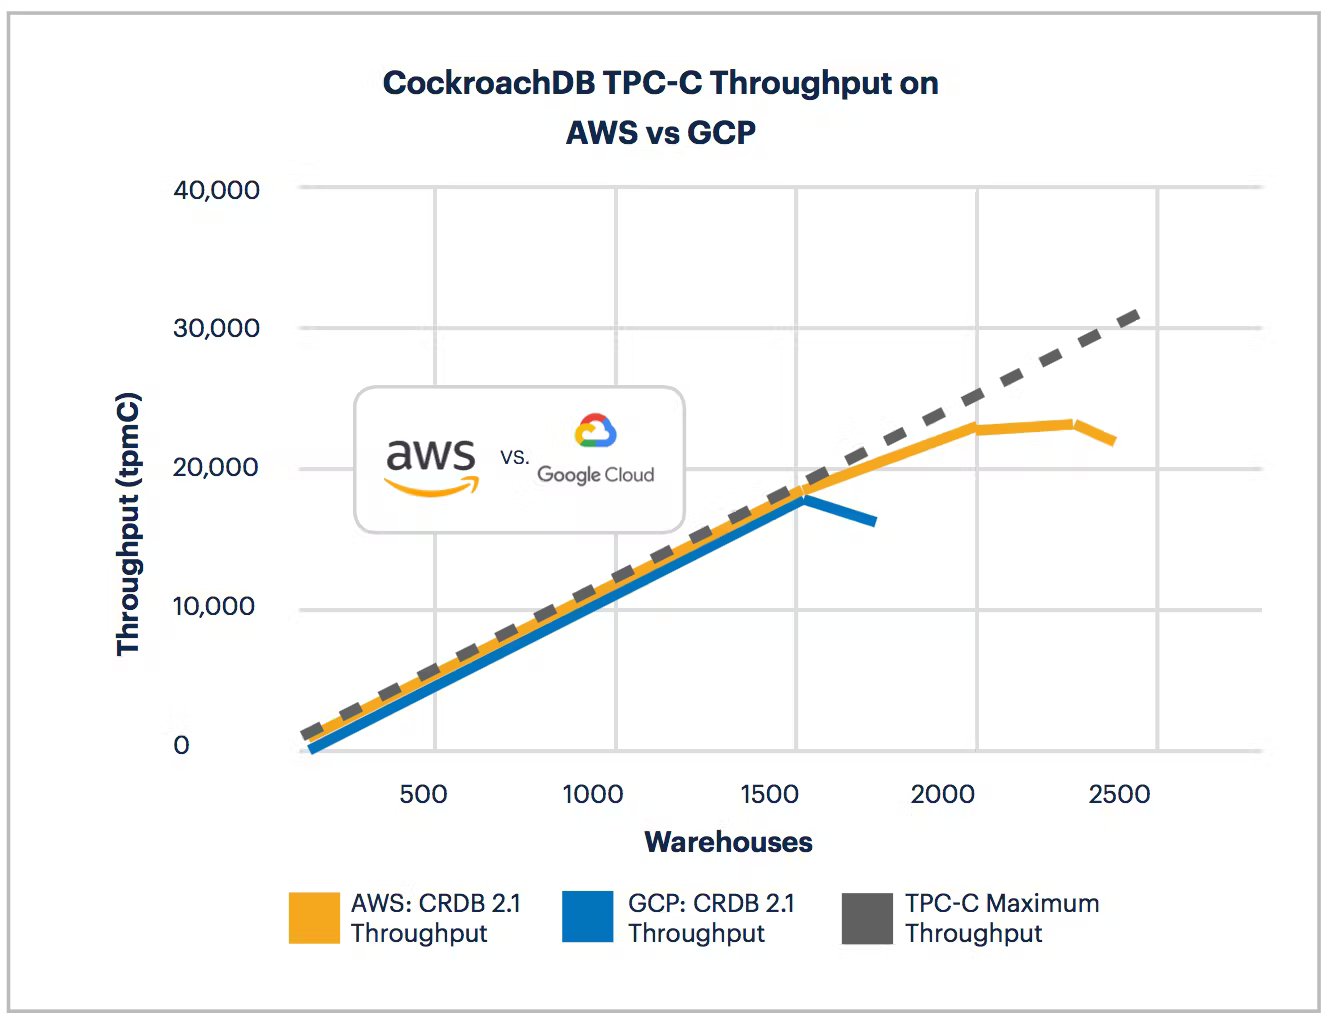
CockroachDB 2.1 achieves 40% more throughput (tpmC) on TPC-C when tested on AWS using c5d.4xlarge than on GCP via n1-standard-16. We were shocked that AWS offered such superior performance.
Previously, our internal testing suggested more equitable outcomes between AWS and GCP. We decided to expand beyond the c5 series to test TPC-C against some of the most popular AWS instance types.
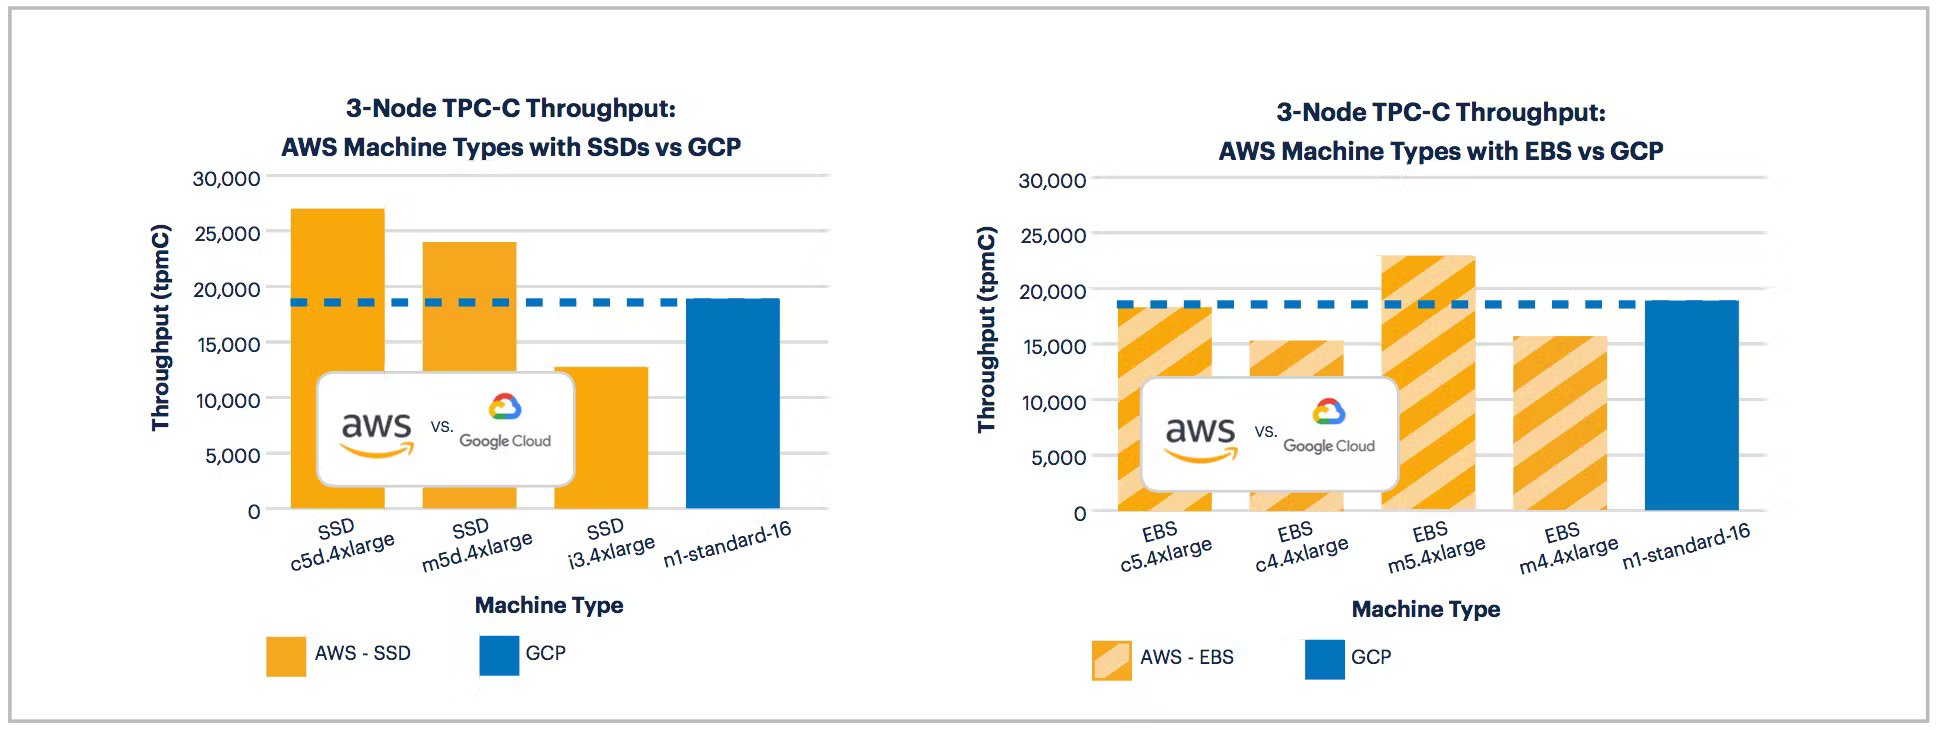
At first blush, it appears that SSDs offered by c5d and m5d outperform EBS. Unfortunately, it’s a bit more complicated than that as AWS offers EBS out of the box with gp2 volume types rather than the higher performing io1 volume type. To isolate this change, we focused on the higher performing c5 series with SSDs, EBS-gp2, and EBS-io1 volume types:
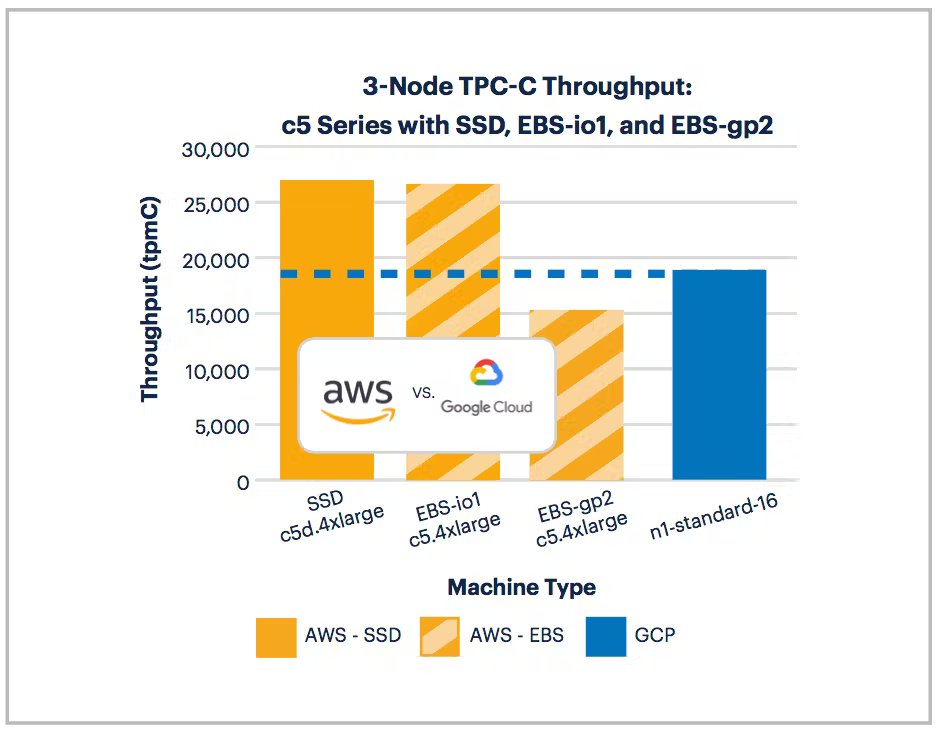
Clearly, EBS volumes can offer effective performance if tuned to the io1 volume type and provided with sufficient iOPS.
So if the difference in TPC-C performance observed among various AWS instance types isn’t explained by SSD vs. EBS, what else might explain it? AWS recently introduced their new Nitro System present in c5 and m5 series. The AWS Nitro System offers approximately the same or superior performance when compared to a similar GCP instance.
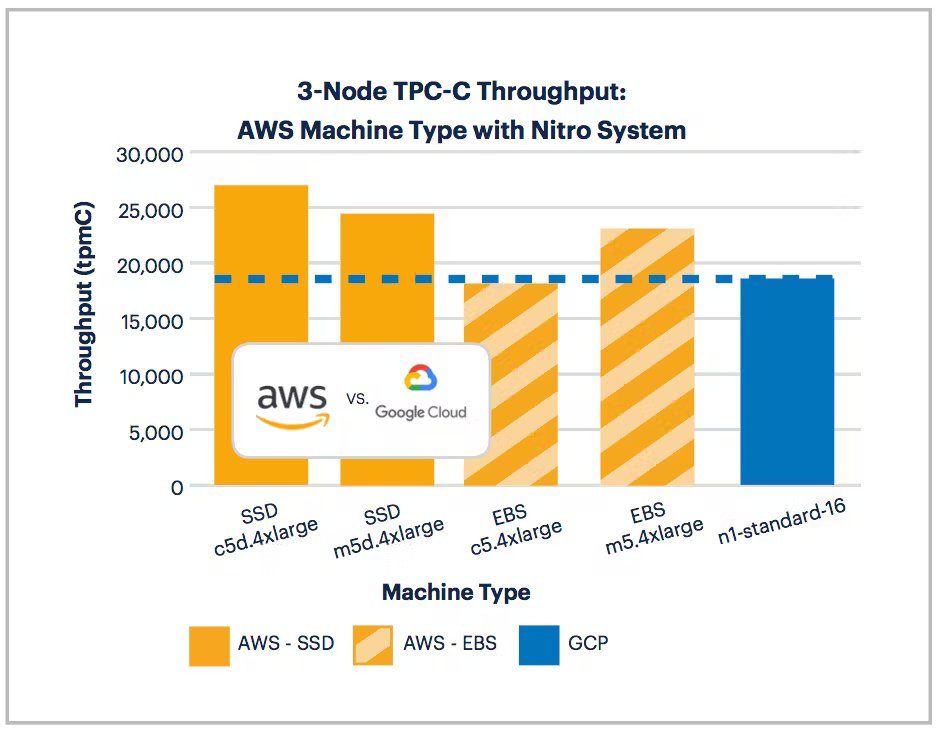
The results were clear: AWS wins on TPC-C benchmark performance. But what causes such large performance differentials? We set out to learn more by testing a series of micro-benchmarks on CPU, network, and I/O.
CPU Experiment
We began our testing like any aspirational scientists by seeking to disprove our main hypothesis:
that cloud platforms' different provisioning policies might affect CPU performance.
We focused on a CPU performance microbenchmark first as it can have a large impact on performance.
To test CPU performance, we needed a 3rd party easy to use benchmark. The two most frequently used benchmark test suites in the market today are sysbench and stress-ng. We chose stress-ng because it offered more benchmarks and provided more flexible configurations than sysbench.
We ran the following Stress-ng command five times on both AWS and GCP: stress-ng --metrics-brief --cpu 16 -t 1m
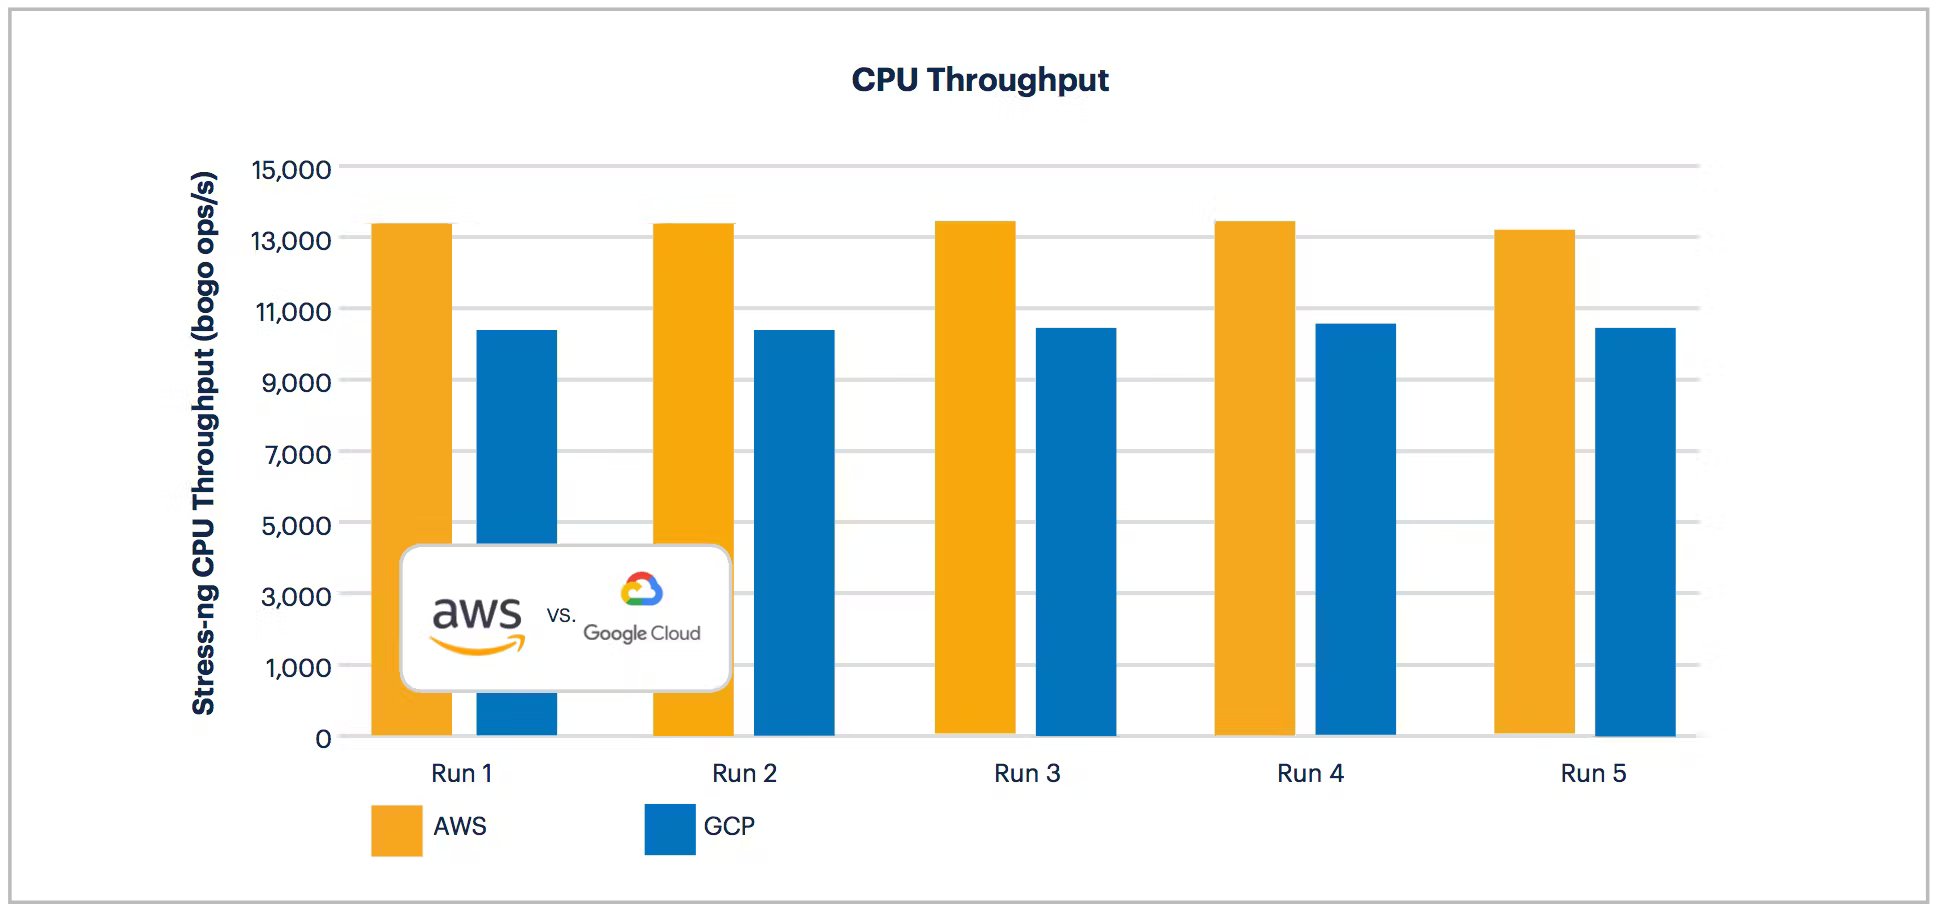
AWS offered 28% more throughput (~2,900 bogo ops/s) on average on stress-ng than GCP. This is a credit to the investments made by both platforms as unpredictability can have a material cost for business paid in the over-provisioning of virtual machines. Note that the Skylake series (used in this experiment) offers a marginal 4% improvement over standard hardware on GCPs n1-standard-16.
Now that we observed an initial difference in both CPU performance on GCP and AWS, we couldn’t help ourselves from continuing to investigate other potential differences. Was the entirety of the TPC-C difference generated from the advantage in CPU performance?
Network Experiment
Next, we tested network throughput and latency. To test the network, we measured throughput using a popular tool called iPerf and latency via another popular tool ping.
iPerf’s configurations include a buffer data size (128KB), a protocol, a server and and a client. iPerf attempts to connect the client and the server with the data from buffer size via the protocol. We set up iPerf similarly to this blog post. This test provides a throughout for the network which allows for us to compare the performance of the network on AWS and GCP. We ran the test four times each for AWS and GCP and aggregated the results of all four tests in histograms (each 1 sec run is stacked to form this chart):
Note: An earlier version of this test showed GCP network throughput using an
n1-standard-4machine type from early November rather than then1-standard-16used throughout the rest of the report. The original data fromn1-standard-4offered much lower throughput (coupled with a greater variance) as compared to then1-standard-16.
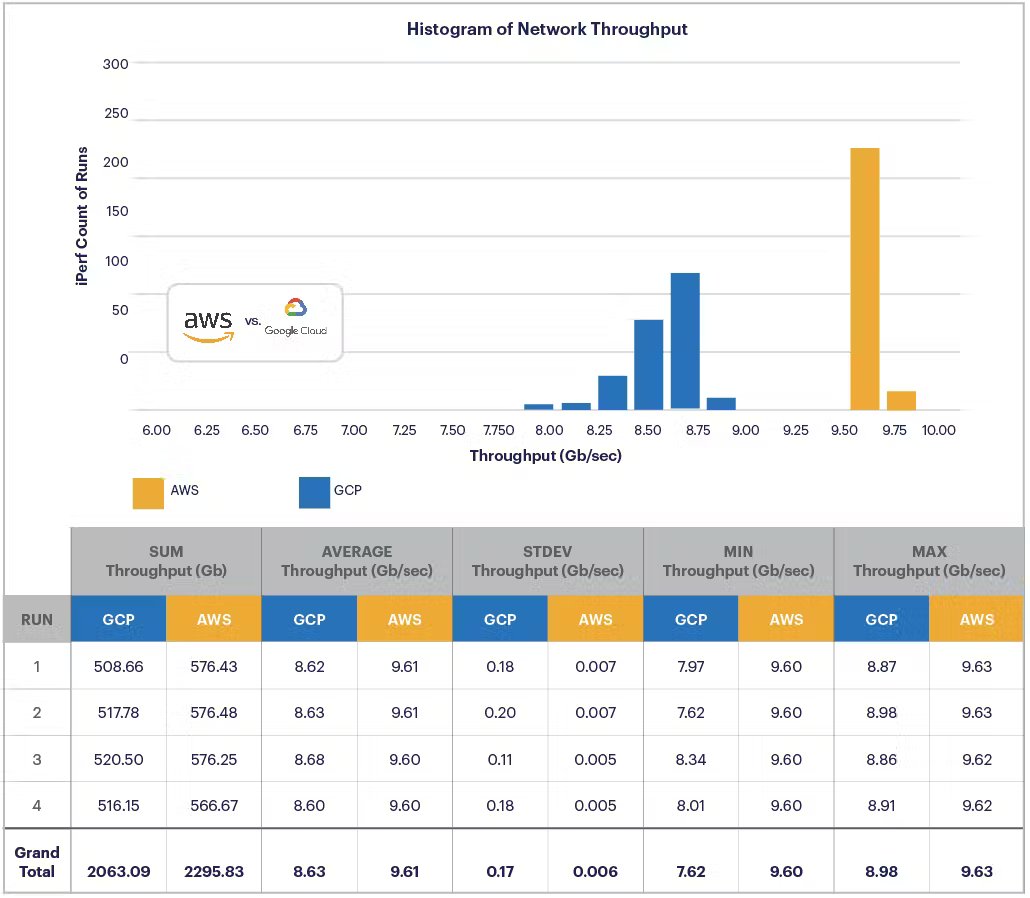
GCP shows a skewed left normal distribution of network throughput centered at ~8.6 Gb/sec. In addition to the raw network throughput, we also care about the variance of the network throughput so that we can have consistent expectations for the network performance. Throughput ranges from 7.62 Gb/sec to 8.91 Gb/sec — a somewhat unpredictable spread of network performance, reinforced by the observed average variance for GCP of 0.17 Gb/sec.
AWS, on the other hand, offers higher throughput, centered on 9.6 Gb/sec, while providing a tighter spread between 9.60 Gb/sec and 9.63 Gb/sec when compared to GCP. On AWS, iPerf transferred a total network throughput of 2,296 Gb in 60 seconds across all four runs. This is an increase of 11% over GCP. On average this is more than 1 Gb/sec increase in throughput.
What about network throughput standard deviation? On AWS, the standard deviation is only 0.006 Gb/sec. This means that the GCP network standard deviation of 0.17 Gb/sec is ~27x more than on AWS.
We tested network latency, in addition to the throughput and variance. Without testing for latency we can miss significant delays in service that may be masked by overall performance. We used the industry standard tool ping to measure latency.
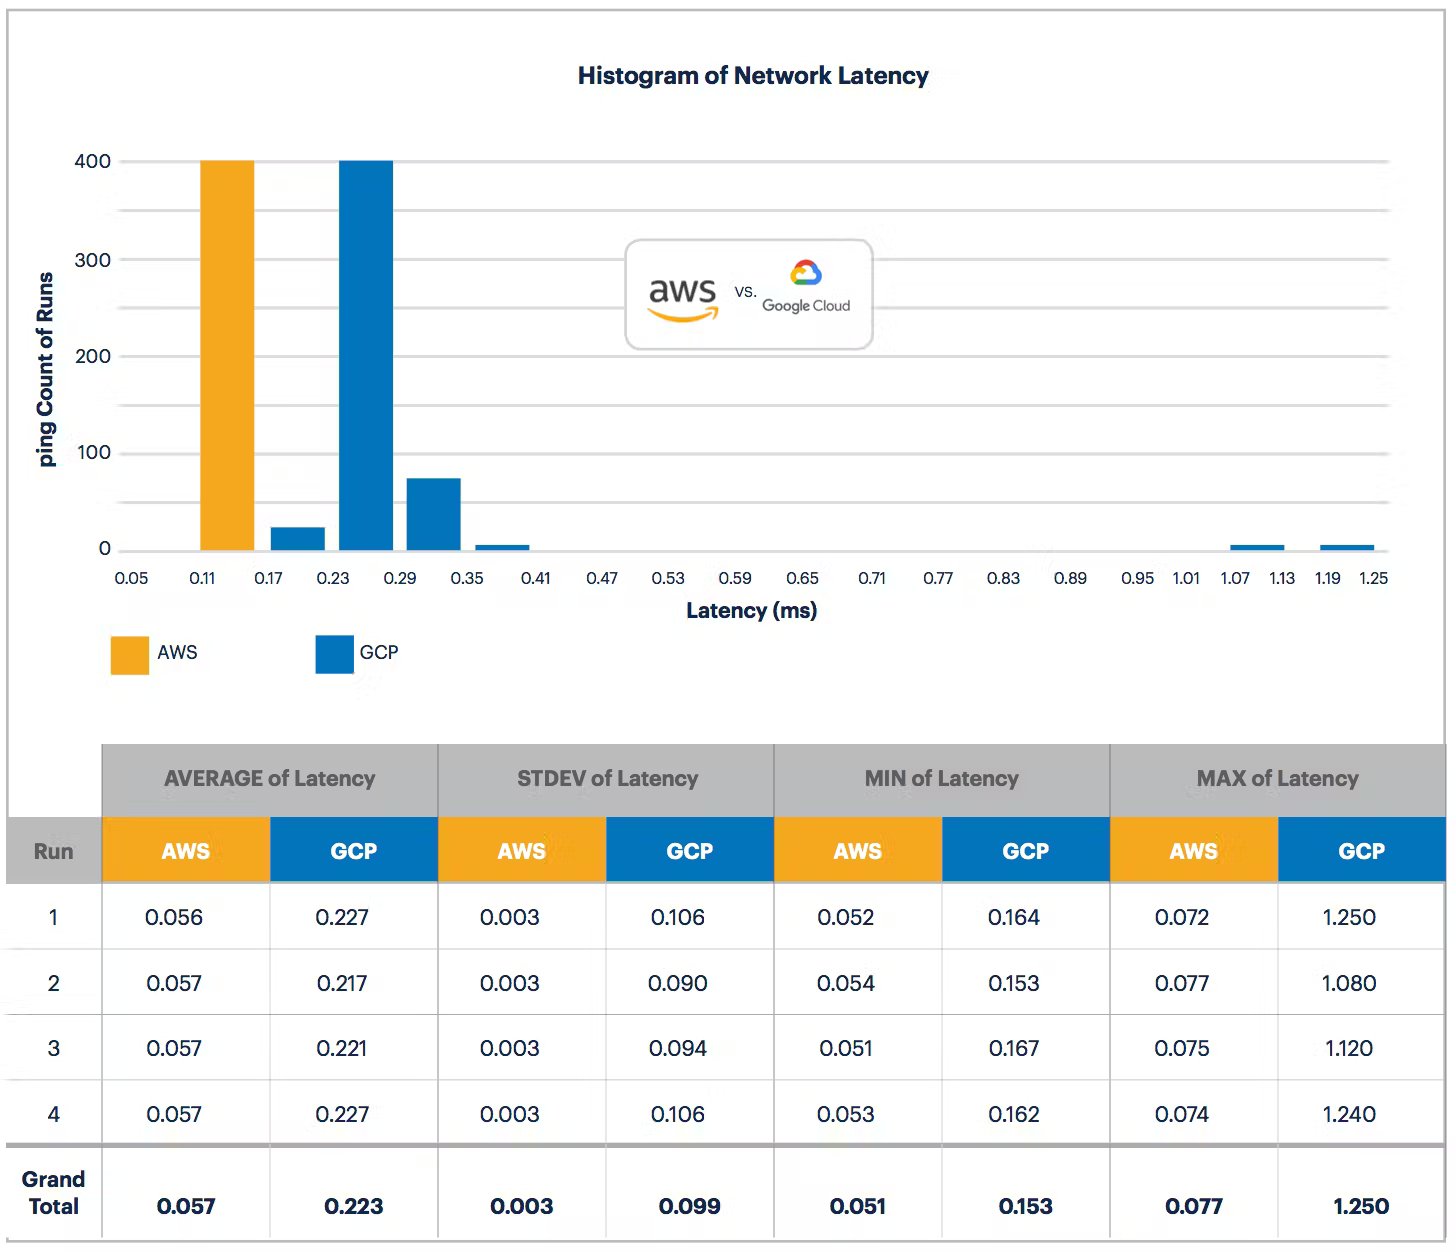
Like network throughput, AWS has a tighter network latency than GCP. Looking at the data closely, we can see that there are several outliers such that the max latency, 1.25 ms, is more than 5 times the average!
Similarly, to network throughput, AWS offers a stark difference to GCP.
AWS’s values are centered on an average latency, 0.057 ms. In fact the spread is so tight it can’t be visualized on the same scale as GCP. The max latency is only 0.077 — a difference of only .02 ms (or 35%) from the average!
AWS offers significantly better network throughput and latency with none of the variability present in GCP. Further, it looks like Amazon may be racing further ahead in network performance with the introduction of the c5n machine type that offers significantly higher network performance across all instance sizes as compared to the rest of the c series.
I/O Experiment
Note: Many readers expressed interest in further understanding our observations with and without
nobarrier. We have adapted this original post to expand upon the published numberswithout nobarrierto include thewith nobarriernumbers.
In this section, we investigate the maximum I/O performance attainable when the application is able to tolerate unreliable writes to its disk (e.g., when VMs are ephemeral). We tested I/O with the same machine types as above (using c5d.4xlarge and n1-standard-16) using a configuration of sysbench that simulates small writes with frequent syncs for both write and read performance. This test measures throughput and latency based on a fixed set of threads, or the number of items concurrently writing to disk.
We ran this experiment with nobarrier and without nobarrier (don’t you just love double negatives?).
Why
nobarrierMattersAs a refresher,
nobarrieris a method of writing directly to disk without guaranteeing that writes will be persisted in the same order in which they were performed. In many cases,nobarriercan offer superior performance, but at the risk of data loss. In the event of a power failure, data on disk can be corrupted causing you to lose meaningful data. In traditional deployments,nobarrieris used with battery-backed write caches. In cloud environments it is difficult to tell exactly what hardware is used, but it's also unnecessary: local SSDs do not survive a reboot of the host machine, so it is safe to setnobarrieron a cloud local SSD.We conduct most of our performance tests using
nobarrierto demonstrate the best possible performance but understand that not all use cases can support this option. As a result, we tested I/O with and withoutnobarrieron GCP and AWS. Note,nobarrierhas no impact on CPU or network testing and was not used to conduct those experiments.
First, we tested write performance:

AWS consistently offers more write throughput across all thread variance from 1 thread up to 64 both with nobarrier and without. In fact, it can be as high as 67x difference in throughput on 1 thread throughput without nobarrier.
It’s also easy to observe that GCP benefits from nobarrier to a much greater degree than AWS. It’s unclear why this difference between cloud providers exists on nobarrier, and we will avoid speculating but do hope to learn more.
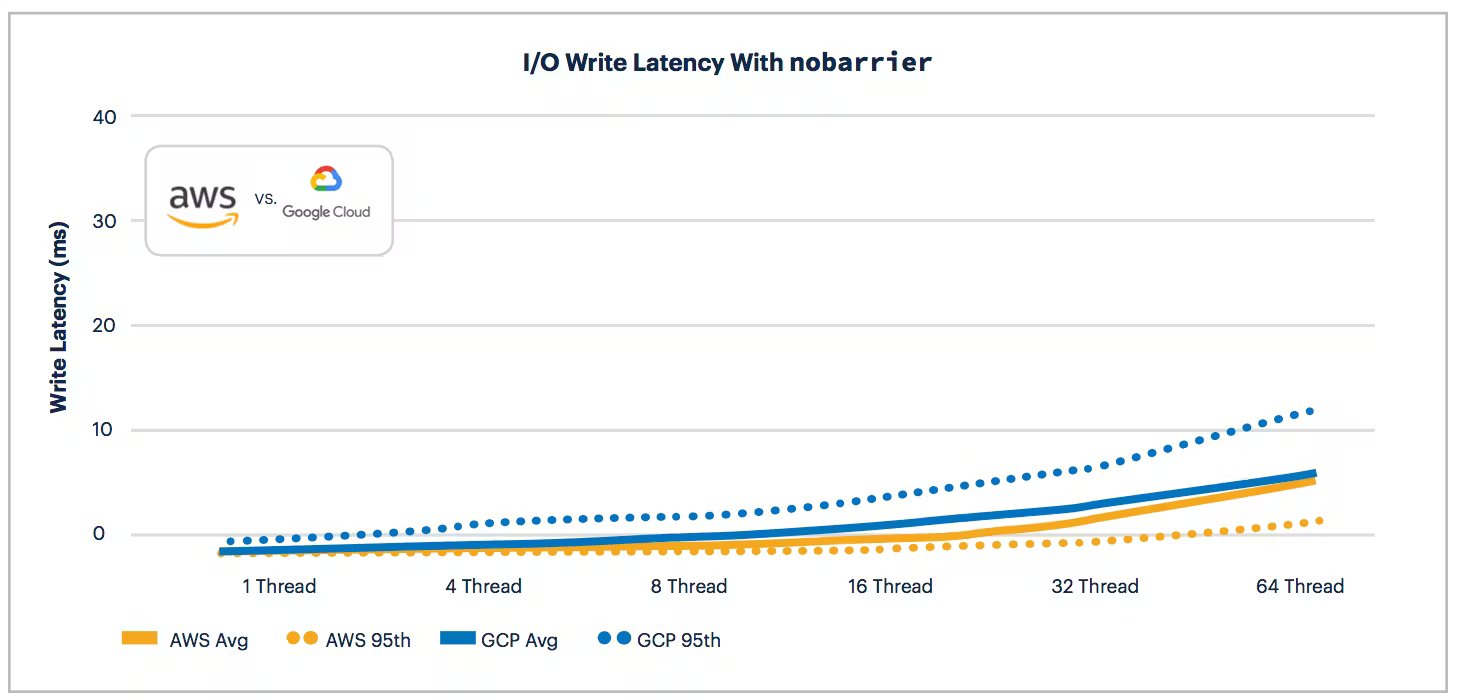
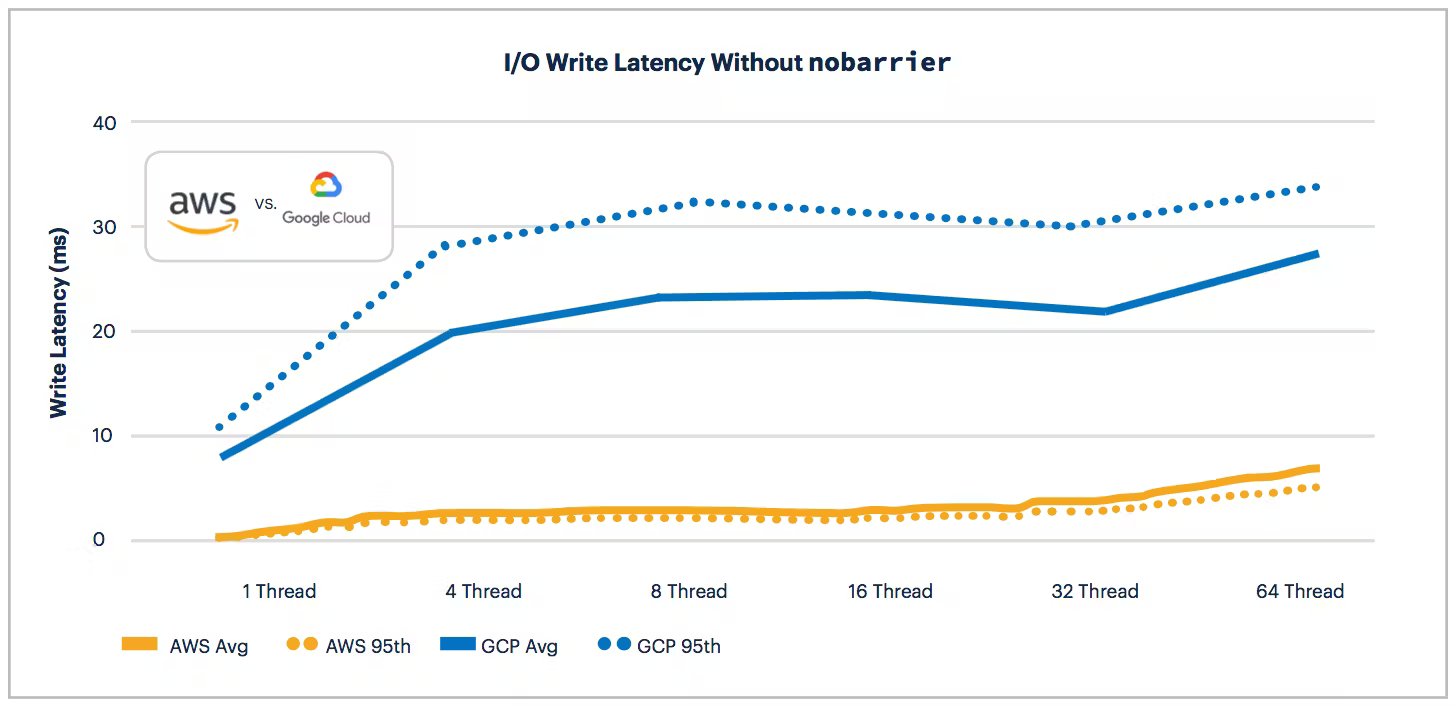
AWS also offers better average and 95th percentile write latency across all thread tests with and without nobarrier.
AWS held clear advantages in write throughput and latency. What about read throughput and latency?
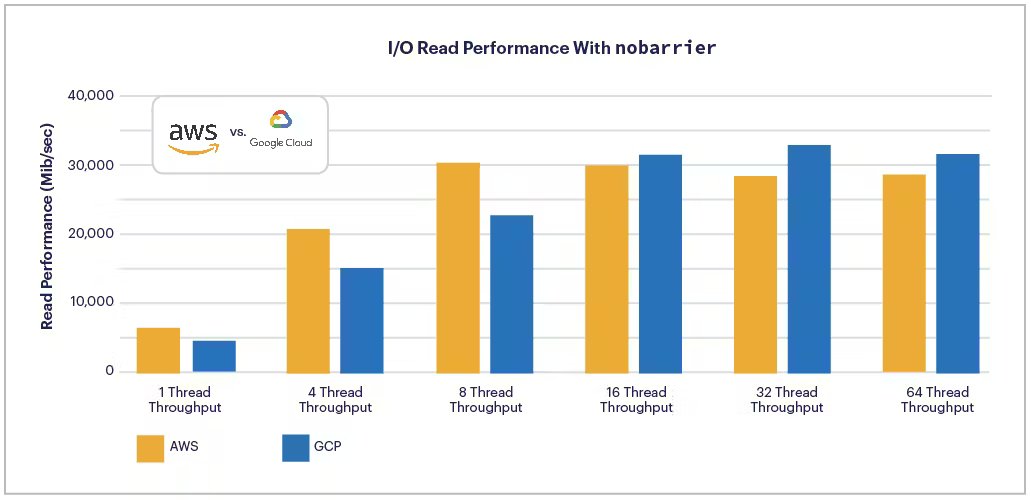
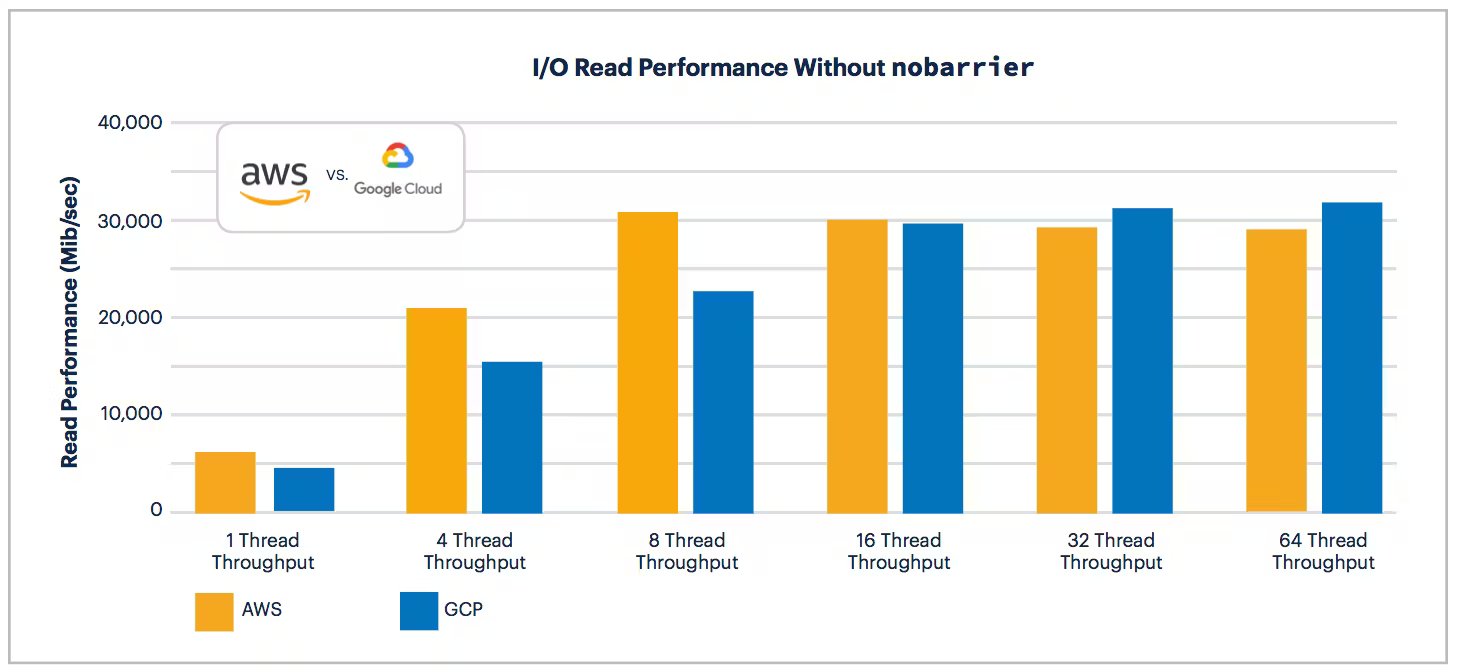
AWS provides more read throughput from 1 to 8 threads with and without nobarrier. nobarrier begins to make a difference at 16 threads tipping the advantage to GCP and marginally increases the advantage GCP has at higher thread count.
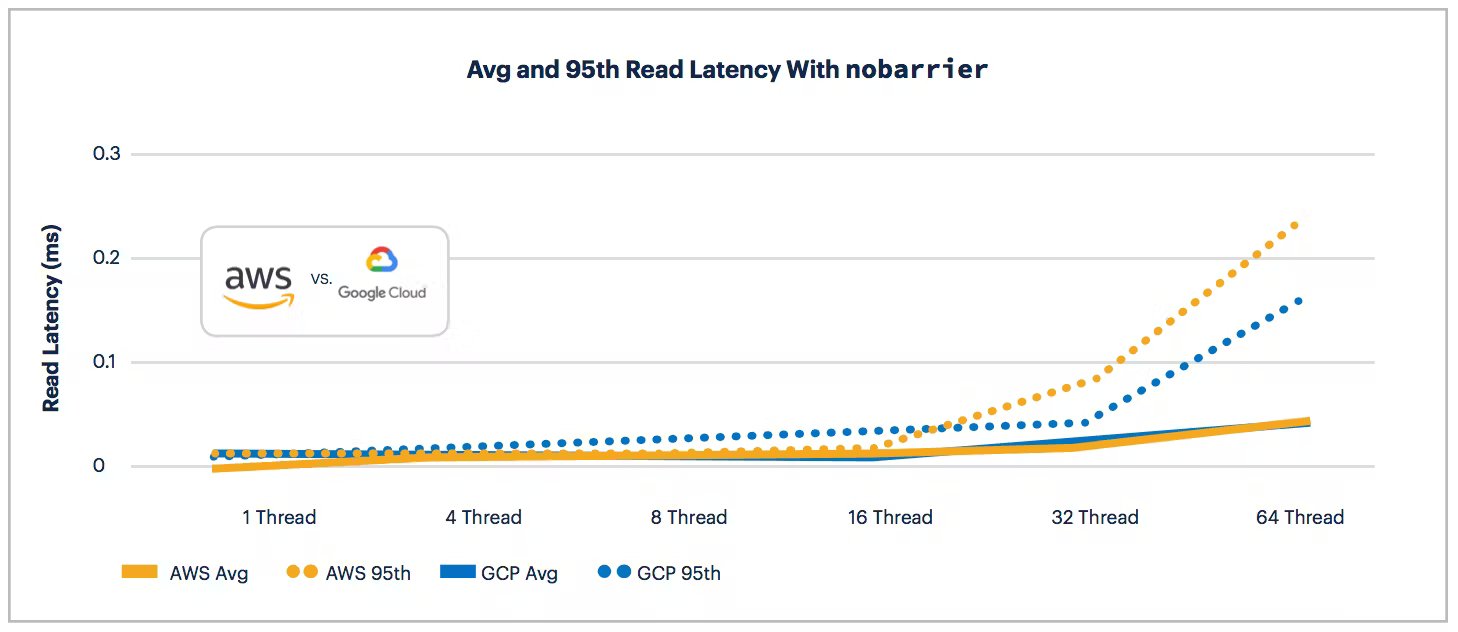
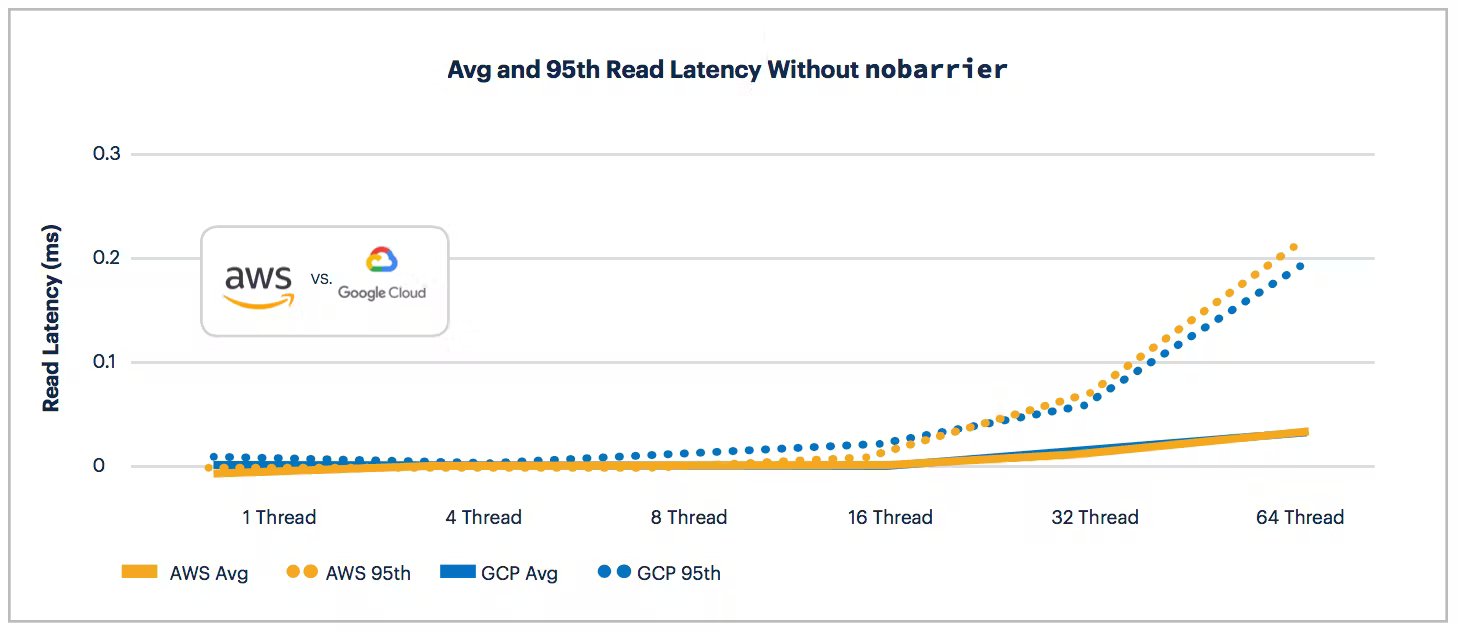
Similarly to read throughput, AWS wins the read latency battle up to 16 threads. At 32 and 64 threads GCP and AWS split the results with and without nobarrier.
Overall, AWS wins for write performance at all threads and read performance up to 16 threads. GCP offers a marginally better performance with similar latency to AWS for read performance at 32 threads and up which can be improved upon by using the nobarrier option.
Note: We evaluated the I/O performance of storage using locally-attached SSD devices. Results for durable network storage devices are likely to be different and should be considered independent of these findings.
Cost
On applied benchmarks (e.g., TPC-C) and the more descriptive micro-benchmark — CPU, network, and I/O — AWS outperformed GCP. But at what cost? Do you pay for this increased performance on AWS?
Let’s circle back to the TPC-C setup discussed at the beginning. For TPC-C, we used n1-standard-16 on GCP with local SSD and c5d.4xlarge on AWS. For both clouds we assumed the most generous discounts available:
On GCP we assumed a three-year committed use price discount with local SSD in the central region.
On AWS we assumed a three-year standard contract paid up front.
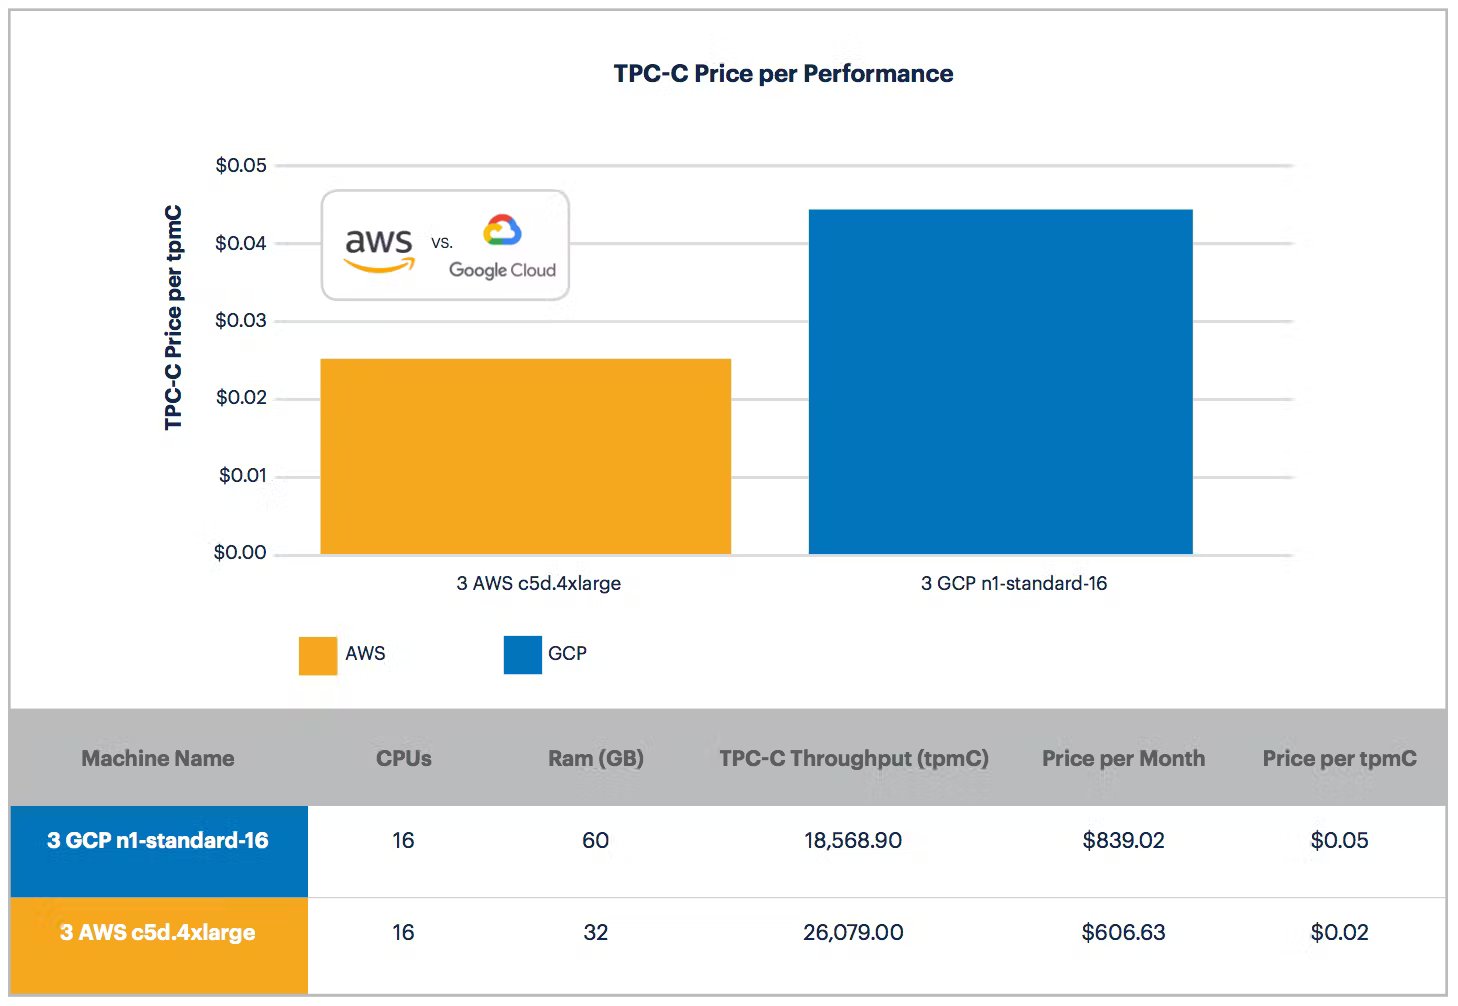
Not only is GCP more expensive than AWS, but it also achieves worse performance. This is doubly reflected in the price per performance (below), which shows GCP costing ~2 times more than AWS per tpmC (the primary metric of throughput in TPC-C)!
Conclusions of the 2018 Cloud Report
AWS outperformed GCP on applied performance (e.g., TPC-C) and a variety of micro-benchmarks (e.g, CPU, network, and I/O) as well as cost.
CockroachDB remains committed to our stance as a cloud-agnostic database. We will continue to use GCP, AWS, Microsoft Azure, and others for internal stability and performance testing. We also expect that these results will change over time as all three companies continue to invest in the modern infrastructure ecosystem.
Note, the 2018 Cloud Report focused on evaluating AWS and GCP because they are the most popular cloud platforms among our customers. In future editions, we plan to expand upon our testing with Microsoft Azure, Digital Ocean, and other cloud platforms.


