- 以前は(おそらく)ヒストグラムを表示させたらbarの境目の線(分割線)が出ていた
- hist関数のオプションに
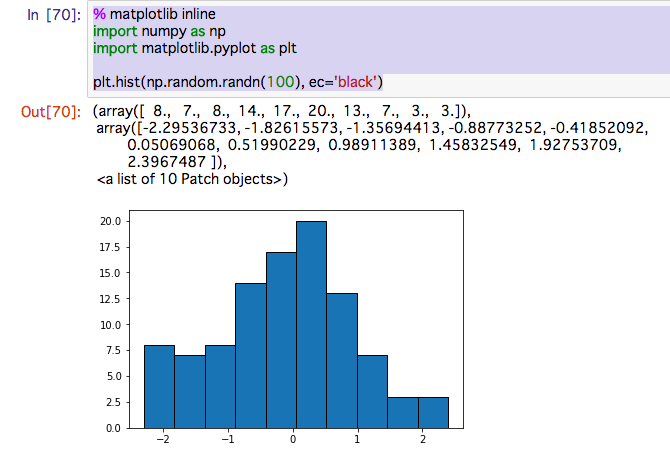
ec='black'を追加してやると良い
Python 3.6.0, matplotlib 2.0.0 を使用
Jupyter-notebookで動作確認
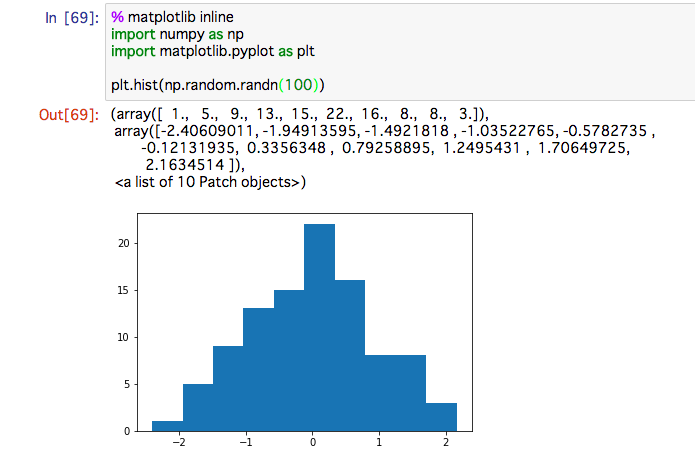
デフォルトではヒストグラムそれぞれのbarの分割がされない
例えば下記コードだとそれぞれのbarの境目が出てこない
% matplotlib inline
import numpy as np
import matplotlib.pyplot as plt

plt.hist(np.random.randn(100))
matplotlib2.0.0から変更になったのかな・・・
documentを読んでもオプションにそれらしきものは見当たらず
ので、調べてみると下記がヒット
python - Cannot get histogram to show separated bins with vertical lines - Stack Overflow
下記コードのように、pyplotのhist関数に ec='black' を加えてやればよい
% matplotlib inline
import numpy as np
import matplotlib.pyplot as plt

plt.hist(np.random.randn(100), ec='black')
- もちろん、
ec='red'など別の色でも指定できるので色々と試してみると良い - ecは edgecolor の略のよう
(seaborn使えと言われたら・・・)