How to Build a Recurrent Neural Network in TensorFlow
This is a no-nonsense overview of implementing a recurrent neural network (RNN) in TensorFlow. Both theory and practice are covered concisely, and the end result is running TensorFlow RNN code.
By Erik Hallström, Deep Learning Research Engineer.
In this tutorial I’ll explain how to build a simple working Recurrent Neural Network in TensorFlow. This is the first in a series of seven parts where various aspects and techniques of building Recurrent Neural Networks in TensorFlow are covered. A short introduction to TensorFlow is available here. For now, let’s get started with the RNN!
What is a RNN?
It is short for “Recurrent Neural Network”, and is basically a neural network that can be used when your data is treated as a sequence, where the particular order of the data-points matter. More importantly, this sequence can be of arbitrary length.
The most straight-forward example is perhaps a time-series of numbers, where the task is to predict the next value given previous values. The input to the RNN at every time-step is the current value as well as a state vector which represent what the network has “seen” at time-steps before. This state-vector is the encoded memory of the RNN, initially set to zero.
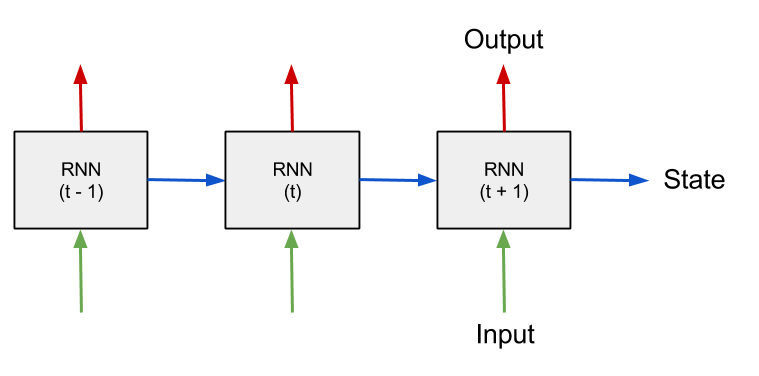
Schematic of a RNN processing sequential data over time.
The best and most comprehensive article explaining RNN's I’ve found so far is this article by researchers at UCSD, highly recommended. For now you only need to understand the basics, read it until the “Modern RNN architectures”-section. That will be covered later.
Although this article contains some explanations, it is mostly focused on the practical part, how to build it. You are encouraged to look up more theory on the Internet, there are plenty of good explanations.
Setup
We will build a simple Echo-RNN that remembers the input data and then echoes it after a few time-steps. First let’s set some constants we’ll need, what they mean will become clear in a moment.
Generate data
Now generate the training data, the input is basically a random binary vector. The output will be the “echo” of the input, shifted echo_step steps to the right.
Notice the reshaping of the data into a matrix with batch_size rows. Neural networks are trained by approximating the gradient of loss function with respect to the neuron-weights, by looking at only a small subset of the data, also known as a mini-batch. The theoretical reason for doing this is further elaborated in this question. The reshaping takes the whole dataset and puts it into a matrix, that later will be sliced up into these mini-batches.
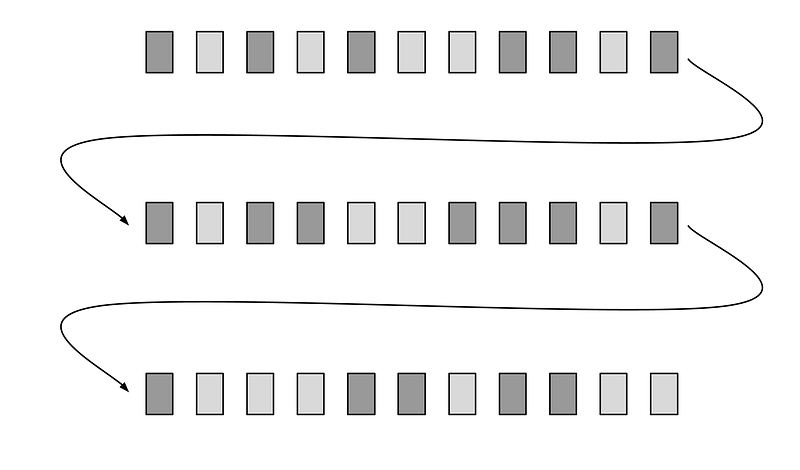
Schematic of the reshaped data-matrix, arrow curves shows adjacent time-steps that ended up on different rows. Light-gray rectangle represent a “zero” and dark-gray a “one”.
Building the computational graph
TensorFlow works by first building up a computational graph, that specifies what operations will be done. The input and output of this graph is typically multidimensional arrays, also known as tensors. The graph, or parts of it can then be executed iteratively in a session, this can either be done on the CPU, GPU or even a resource on a remote server.
Variables and placeholders
The two basic TensorFlow data-structures that will be used in this example are placeholders and variables. On each run the batch data is fed to the placeholders, which are “starting nodes” of the computational graph. Also the RNN-state is supplied in a placeholder, which is saved from the output of the previous run.
The weights and biases of the network are declared as TensorFlow variables, which makes them persistent across runs and enables them to be updated incrementally for each batch.
The figure below shows the input data-matrix, and the current batch batchX_placeholder is in the dashed rectangle. As we will see later, this “batch window” is slided truncated_backprop_length steps to the right at each run, hence the arrow. In our example below batch_size = 3, truncated_backprop_length = 3, and total_series_length = 36. Note that these numbers are just for visualization purposes, the values are different in the code. The series order index is shown as numbers in a few of the data-points.
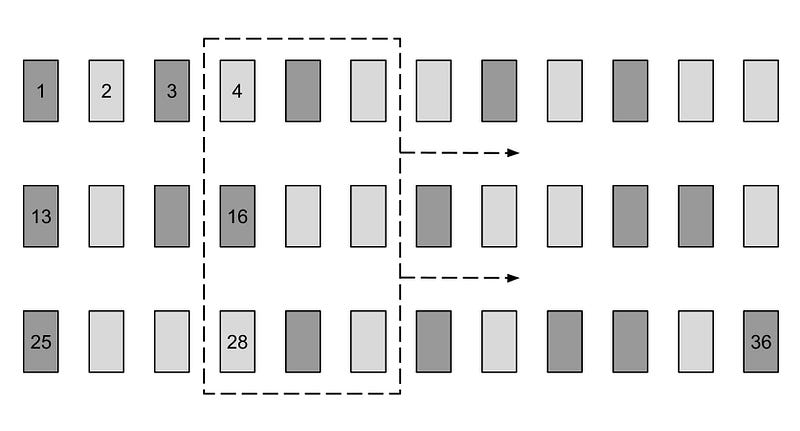
Schematic of the training data, the current batch is sliced out in the dashed rectangle. The time-step index of the datapoint is displayed.
Unpacking
Now it’s time to build the part of the graph that resembles the actual RNN computation, first we want to split the batch data into adjacent time-steps.
As you can see in the picture below that is done by unpacking the columns (axis = 1) of the batch into a Python list. The RNN will simultaneously be training on different parts in the time-series; steps 4 to 6, 16 to 18 and 28 to 30 in the current batch-example. The reason for using the variable names “plural”_”series” is to emphasize that the variable is a list that represent a time-series with multiple entries at each step.
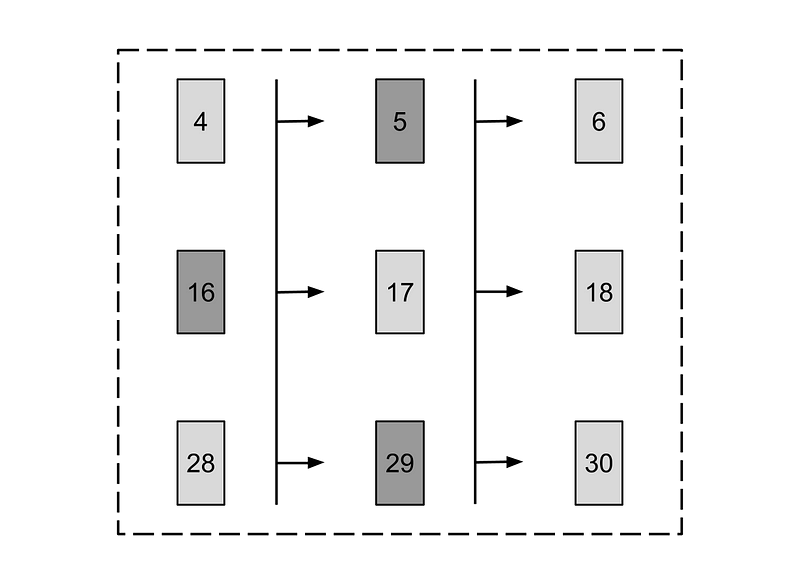
Schematic of the current batch split into columns, the order index is shown on each data-point and arrows show adjacent time-steps.
The fact that the training is done on three places simultaneously in our time-series, requires us to save three instances of states when propagating forward. That has already been accounted for, as you see that the init_state placeholder has batch_size rows.
Forward pass
Next let’s build the part of the graph that does the actual RNN computation.
Notice the concatenation on line 6, what we actually want to do is calculate the sum of two affine transforms current_input * Wa + current_state * Wbin the figure below. By concatenating those two tensors you will only use one matrix multiplication. The addition of the bias b is broadcasted on all samples in the batch.
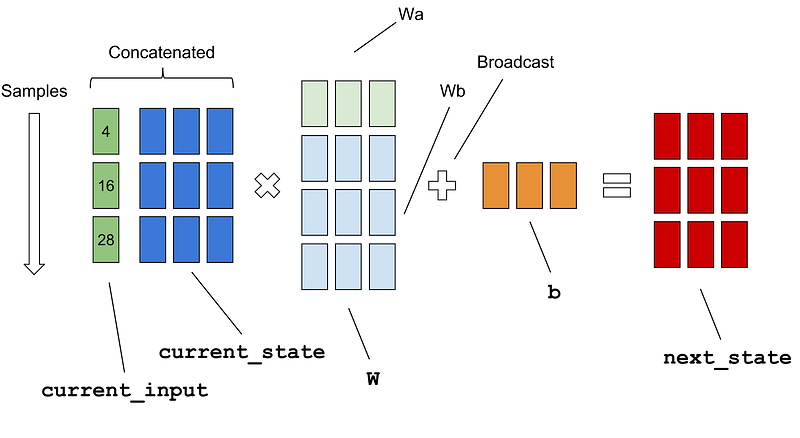
Schematic of the computations of the matrices on line 8 in the code example above, the non-linear transform arctan is omitted.
You may wonder the variable name truncated_backprop_length is supposed to mean. When a RNN is trained, it is actually treated as a deep neural network with reoccurring weights in every layer. These layers will not be unrolled to the beginning of time, that would be too computationally expensive, and are therefore truncated at a limited number of time-steps. In our sample schematics above, the error is backpropagated three steps in our batch.
Calculating loss
This is the final part of the graph, a fully connected softmax layer from the state to the output that will make the classes one-hot encoded, and then calculating the loss of the batch.
The last line is adding the training functionality, TensorFlow will perform back-propagation for us automatically — the computation graph is executed once for each mini-batch and the network-weights are updated incrementally.
Notice the API call to sparse_softmax_cross_entropy_with_logits, it automatically calculates the softmax internally and then computes the cross-entropy. In our example the classes are mutually exclusive (they are either zero or one), which is the reason for using the “Sparse-softmax”, you can read more about it in the API. The usage is to havelogits is of shape [batch_size, num_classes] and labels of shape [batch_size].
Visualizing the training
There is a visualization function so we can se what’s going on in the network as we train. It will plot the loss over the time, show training input, training output and the current predictions by the network on different sample series in a training batch.
Running a training session
It’s time to wrap up and train the network, in TensorFlow the graph is executed in a session. New data is generated on each epoch (not the usual way to do it, but it works in this case since everything is predictable).
You can see that we are moving truncated_backprop_length steps forward on each iteration (line 15–19), but it is possible have different strides. This subject is further elaborated in this article. The downside with doing this is that truncated_backprop_length need to be significantly larger than the time dependencies (three steps in our case) in order to encapsulate the relevant training data. Otherwise there might a lot of “misses”, as you can see on the figure below.
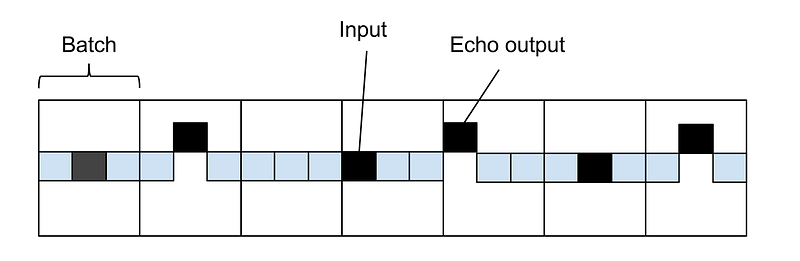
Time series of squares, the elevated black square symbolizes an echo-output, which is activated three steps from the echo input (black square). The sliding batch window is also striding three steps at each run, which in our sample case means that no batch will encapsulate the dependency, so it can not train.
Also realize that this is just simple example to explain how a RNN works, this functionality could easily be programmed in just a few lines of code. The network will be able to exactly learn the echo behavior so there is no need for testing data.
The program will update the plot as training progresses, shown in the picture below. Blue bars denote a training input signal (binary one), red bars show echos in the training output and green bars are the echos the net is generating. The different bar plots show different sample series in the current batch.
Our algorithm will fairly quickly learn the task. The graph in the top-left corner shows the output of the loss function, but why are there spikes in the curve? Think of it for a moment, answer is below.
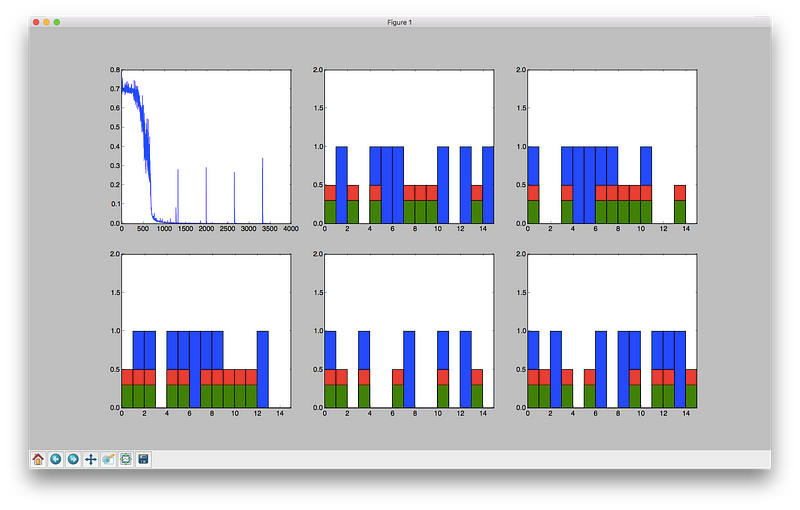
Visualization of the loss, input and output training data (blue, red) as well as the prediction (green).
The reason for the spikes is that we are starting on a new epoch, and generating new data. Since the matrix is reshaped, the first element on each row is adjacent to the last element in the previous row. The first few elements on all rows (except the first) have dependencies that will not be included in the state, so the net will always perform badly on the first batch.
Whole program
This is the whole runnable program, just copy-paste and run. After each part in the article series the whole runnable program will be presented. If a line is referenced by number, these are the line numbers that we mean.
Bio: Erik Hallström is a Deep Learning Research Engineer at Sana. He studied Engineering Physics and Machine Learning at Royal Institute of Technology in Stockholm. Also been living in Taiwan 學習中文. Interested in Deep Learning.
Original. Reposted with permission.
Related: